8. PyrNet automatic quality checks
In the following, functions for automatic quality screening are developed. Including BSRN recommended physical and rare limits, as well as network sanity checks.
#|export
import xarray as xr
import numpy as np
import warnings
import logging

import pyrnet.data
import pyrnet.utils


# logging setup
logging.basicConfig(
    filename='pyrnet.log',
    encoding='utf-8',
    level=logging.DEBUG,
    format='%(asctime)s %(name)s %(levelname)s:%(message)s'
)
logger = logging.getLogger(__name__)
import matplotlib.pyplot as plt
#|export
class CONSTANTS:
    S0 = 1367  # W m-2
    k = 5.67*1e-8
8.1. BSRN recommended checks
BSRN recommends thresholds for physical and rare limits of GHI data
#|export
class QCCode:
    """ BSRN quality codes
    https://wiki.pangaea.de/wiki/BSRN_Toolbox#Quality_Check
    """
    below_physical = 2**0 # 1
    above_phyiscal = 2**1 # 2
    below_rare = 2**2 # 4
    above_rare = 2**3 # 8
    compare_to_low = 2**4 # 16
    compare_to_high = 2**5 # 32
    quality_control_failed = 2**6 # 64
8.2. Additional Flags
Outlier and probability of bird or random shading detection
#|export
class FLCode:
    """ Codes for additional pyrnet flags.
    """
    low_outlier = 2**0 # 1
    strong_fluctuation = 2**1 # 2 Strong fluctuation, which maybe logger failiure
    not_applicable = 2**2
8.3. Load test dataset:
Show code cell source
Hide code cell source
#|dropcode
#|dropout
fname = "../../example_data/to_l1b_output.nc"
ds_l1b = xr.load_dataset(fname)
ds_l1b
Show code cell output
Hide code cell output
<xarray.Dataset> Size: 1kB
Dimensions:               (station: 1, time: 9, maintenancetime: 1)
Coordinates:
  * station               (station) float64 8B 1.0
  * time                  (time) datetime64[ns] 72B 2022-08-30T11:21:01 ... 2...
  * maintenancetime       (maintenancetime) datetime64[ns] 8B 2023-05-08T16:0...
Data variables: (12/20)
    ghi                   (time, station) float64 72B 280.9 280.9 ... 280.9
    gti                   (time, station) float64 72B 288.9 288.9 ... 289.4
    ta                    (time, station) float64 72B 294.8 294.7 ... 294.8
    rh                    (time, station) float64 72B 0.6253 0.6248 ... 0.629
    battery_voltage       (time, station) float64 72B 6.443 6.445 ... 6.465
    gti_min               (time, station) float64 72B 288.7 288.7 ... 288.7
    ...                    ...
    maintenance_flag_gti  (maintenancetime, station) float32 4B 7.0
    szen                  (time, station) float64 72B 42.51 42.51 ... 42.51
    sazi                  (time, station) float64 72B 182.9 182.9 ... 182.9
    esd                   (station) float64 8B 1.01
    qc_flag_ghi           (time, station) float32 36B 0.0 0.0 0.0 ... 0.0 0.0
    qc_flag_gti           (time, station) float32 36B 0.0 0.0 0.0 ... 0.0 0.0
Attributes: (12/31)
    Conventions:               CF-1.10, ACDD-1.3
    title:                     TROPOS pyranometer network (PyrNet) observatio...
    history:                   2024-05-31T13:47:06: Generated level l1a  by p...
    institution:               Leibniz Institute for Tropospheric Research (T...
    source:                    TROPOS pyranometer network (PyrNet)
    references:                https://doi.org/10.5194/amt-9-1153-2016
    ...                        ...
    geospatial_lon_max:        11.885252
    geospatial_lon_units:      degE
    time_coverage_start:       2022-08-30T11:21:01
    time_coverage_end:         2022-08-30T11:21:09
    time_coverage_duration:    P0DT0H0M8S
time_coverage_resolution: P0DT0H0M1S- station: 1
- time: 9
- maintenancetime: 1
- station(station)float641.0
array([1.])
- time(time)datetime64[ns]2022-08-30T11:21:01 ... 2022-08-...
array(['2022-08-30T11:21:01.000000000', '2022-08-30T11:21:02.000000000', '2022-08-30T11:21:03.000000000', '2022-08-30T11:21:04.000000000', '2022-08-30T11:21:05.000000000', '2022-08-30T11:21:06.000000000', '2022-08-30T11:21:07.000000000', '2022-08-30T11:21:08.000000000', '2022-08-30T11:21:09.000000000'], dtype='datetime64[ns]') - maintenancetime(maintenancetime)datetime64[ns]2023-05-08T16:09:06
array(['2023-05-08T16:09:06.000000000'], dtype='datetime64[ns]')
- ghi(time, station)float64280.9 280.9 280.9 ... 280.9 280.9
- units :
- W m-2
- long_name :
- downwelling shortwave flux
- standard_name :
- downwelling_shortwave_flux_in_air
- valid_range :
- [ 0 60000]
- ancillary_variables :
- maintenance_flag_ghi qc_flag_ghi
- serial :
- S12128.001
- calibration_Cabsolute :
- 129366.10608020698
- calibration_Ccoscorr :
- 1.45 - 3.04·x¹ + 5.59·x² - 3.01·x³
- calibration_function :
- flux (W m-2) = flux (V) * Cabsolute (W m-2 V-1) * Ccoscorr(mua)
array([[280.9 ], [280.9 ], [280.9 ], [280.75], [280.9 ], [280.9 ], [280.75], [280.9 ], [280.9 ]]) - gti(time, station)float64288.9 288.9 288.7 ... 288.7 289.4
- units :
- W m-2
- long_name :
- downwelling shortwave flux measured on secondary platform, might be tilted
- standard_name :
- downwelling_shortwave_flux_in_air
- valid_range :
- [ 0 60000]
- ancillary_variables :
- maintenance_flag_gti qc_flag_gti
- hangle :
- 0.0
- vangle :
- 0.0
- serial :
- S12137.049
- calibration_Cabsolute :
- 143266.47564469912
- calibration_Ccoscorr :
- 1.45 - 3.04·x¹ + 5.59·x² - 3.01·x³
- calibration_function :
- flux (W m-2) = flux (V) * Cabsolute (W m-2 V-1) * Ccoscorr(mua)
array([[288.95 ], [288.95 ], [288.65 ], [288.65 ], [288.8 ], [288.65 ], [288.325], [288.65 ], [289.45 ]]) - ta(time, station)float64294.8 294.7 294.8 ... 294.7 294.8
- units :
- K
- long_name :
- air temperature
- standard_name :
- air_temperature
- valid_range :
- [ 0 10000]
array([[294.8 ], [294.74], [294.77], [294.75], [294.79], [294.75], [294.81], [294.73], [294.76]]) - rh(time, station)float640.6253 0.6248 ... 0.628 0.629
- units :
- 1
- long_name :
- air relative humidity
- standard_name :
- relative_humidity
- valid_range :
- [ 0 10000]
array([[0.6253], [0.6248], [0.6259], [0.6266], [0.6271], [0.6271], [0.6286], [0.628 ], [0.629 ]]) - battery_voltage(time, station)float646.443 6.445 6.444 ... 6.449 6.465
- units :
- V
- standard_name :
- battery_voltage
- valid_range :
- [ 0 6400]
array([[6.443], [6.445], [6.444], [6.446], [6.45 ], [6.448], [6.446], [6.449], [6.465]]) - gti_min(time, station)float64288.7 288.7 288.7 ... 288.7 288.7
- units :
- W m-2
- long_name :
- downwelling shortwave flux measured on secondary platform, might be tilted
- standard_name :
- min_downwelling_shortwave_flux_in_air
- valid_range :
- [ 0 60000]
- ancillary_variables :
- maintenance_flag_gti
- hangle :
- 0.0
- vangle :
- 0.0
- serial :
- S12137.049
- calibration_Cabsolute :
- 143266.47564469912
- calibration_Ccoscorr :
- 1.45 - 3.04·x¹ + 5.59·x² - 3.01·x³
- calibration_function :
- flux (W m-2) = flux (V) * Cabsolute (W m-2 V-1) * Ccoscorr(mua)
array([[288.65 ], [288.65 ], [288.65 ], [287.025], [287.025], [288.65 ], [287.025], [288.65 ], [288.65 ]]) - ghi_min(time, station)float64280.9 280.9 280.9 ... 280.9 280.9
- units :
- W m-2
- long_name :
- downwelling shortwave flux
- standard_name :
- min_downwelling_shortwave_flux_in_air
- valid_range :
- [ 0 60000]
- ancillary_variables :
- maintenance_flag_ghi
- serial :
- S12128.001
- calibration_Cabsolute :
- 129366.10608020698
- calibration_Ccoscorr :
- 1.45 - 3.04·x¹ + 5.59·x² - 3.01·x³
- calibration_function :
- flux (W m-2) = flux (V) * Cabsolute (W m-2 V-1) * Ccoscorr(mua)
array([[280.9 ], [280.9 ], [280.9 ], [279.45], [280.9 ], [280.9 ], [279.45], [280.9 ], [280.9 ]]) - gti_max(time, station)float64290.2 290.2 288.7 ... 288.7 290.2
- units :
- W m-2
- long_name :
- downwelling shortwave flux measured on secondary platform, might be tilted
- standard_name :
- max_downwelling_shortwave_flux_in_air
- valid_range :
- [ 0 60000]
- ancillary_variables :
- maintenance_flag_gti
- hangle :
- 0.0
- vangle :
- 0.0
- serial :
- S12137.049
- calibration_Cabsolute :
- 143266.47564469912
- calibration_Ccoscorr :
- 1.45 - 3.04·x¹ + 5.59·x² - 3.01·x³
- calibration_function :
- flux (W m-2) = flux (V) * Cabsolute (W m-2 V-1) * Ccoscorr(mua)
array([[290.25], [290.25], [288.65], [290.25], [290.25], [288.65], [288.65], [288.65], [290.25]]) - ghi_max(time, station)float64280.9 280.9 280.9 ... 280.9 280.9
- units :
- W m-2
- long_name :
- downwelling shortwave flux
- standard_name :
- max_downwelling_shortwave_flux_in_air
- valid_range :
- [ 0 60000]
- ancillary_variables :
- maintenance_flag_ghi
- serial :
- S12128.001
- calibration_Cabsolute :
- 129366.10608020698
- calibration_Ccoscorr :
- 1.45 - 3.04·x¹ + 5.59·x² - 3.01·x³
- calibration_function :
- flux (W m-2) = flux (V) * Cabsolute (W m-2 V-1) * Ccoscorr(mua)
array([[280.9], [280.9], [280.9], [280.9], [280.9], [280.9], [280.9], [280.9], [280.9]]) - gti_std(time, station)float640.725 0.675 0.0 ... 0.675 0.0 1.125
- units :
- W m-2
- long_name :
- downwelling shortwave flux measured on secondary platform, might be tilted
- standard_name :
- std_downwelling_shortwave_flux_in_air
- valid_range :
- [ 0 60000]
- ancillary_variables :
- maintenance_flag_gti
- hangle :
- 0.0
- vangle :
- 0.0
- serial :
- S12137.049
- calibration_Cabsolute :
- 143266.47564469912
- calibration_Ccoscorr :
- 1.45 - 3.04·x¹ + 5.59·x² - 3.01·x³
- calibration_function :
- flux (W m-2) = flux (V) * Cabsolute (W m-2 V-1) * Ccoscorr(mua)
array([[0.725], [0.675], [0. ], [0.75 ], [0.9 ], [0. ], [0.675], [0. ], [1.125]]) - ghi_std(time, station)float640.0 0.0 0.0 0.45 ... 0.45 0.0 0.0
- units :
- W m-2
- long_name :
- downwelling shortwave flux
- standard_name :
- std_downwelling_shortwave_flux_in_air
- valid_range :
- [ 0 60000]
- ancillary_variables :
- maintenance_flag_ghi
- serial :
- S12128.001
- calibration_Cabsolute :
- 129366.10608020698
- calibration_Ccoscorr :
- 1.45 - 3.04·x¹ + 5.59·x² - 3.01·x³
- calibration_function :
- flux (W m-2) = flux (V) * Cabsolute (W m-2 V-1) * Ccoscorr(mua)
array([[0. ], [0. ], [0. ], [0.45], [0. ], [0. ], [0.45], [0. ], [0. ]]) - lat(station)float6451.39
- standard_name :
- latitude
- units :
- degree_north
- valid_range :
- [-90. 90.]
array([51.39021033])
- lon(station)float6411.89
- standard_name :
- longitude
- units :
- degree_east
- valid_range :
- [-180. 180.]
array([11.885252])
- maintenance_flag_ghi(maintenancetime, station)float329.0
- standard_name :
- quality_flag
- long_name :
- Maintenance quality control flags
- note :
- Soiling describes subjectively the coverage of the pyranometer dome with dirt. The level flag is problematic if the bubble of the spirit level touches the reference ring, and bad if it is outside.
- valid_range :
- [ 0 11]
- flag_masks :
- [ 3 3 3 12 12]
- flag_values :
- [1 2 3 4 8]
- flag_meanings :
- soiling_light soiling_moderate soiling_heavy level_problematic level_bad
- note_general :
- 222
- note_clean :
- testing notes
- note_level :
- test
array([[9.]], dtype=float32)
- maintenance_flag_gti(maintenancetime, station)float327.0
- standard_name :
- quality_flag
- long_name :
- Maintenance quality control flags
- note :
- Soiling describes subjectively the coverage of the pyranometer dome with dirt. The level flag is problematic if the bubble of the spirit level touches the reference ring, and bad if it is outside.
- valid_range :
- [ 0 11]
- flag_masks :
- [ 3 3 3 12 12]
- flag_values :
- [1 2 3 4 8]
- flag_meanings :
- soiling_light soiling_moderate soiling_heavy level_problematic level_bad
- note_general :
- 222
- note_clean :
- note_level :
array([[7.]], dtype=float32)
- szen(time, station)float6442.51 42.51 42.51 ... 42.51 42.51
- standard_name :
- solar_zenith_angle
- units :
- degree
- valid_range :
- [ 0 36000]
array([[42.51], [42.51], [42.51], [42.51], [42.51], [42.51], [42.51], [42.51], [42.51]]) - sazi(time, station)float64182.9 182.9 182.9 ... 182.9 182.9
- standard_name :
- solar_azimuth_angle
- units :
- degree
- valid_range :
- [ 0 36000]
array([[182.89], [182.9 ], [182.91], [182.91], [182.92], [182.93], [182.93], [182.94], [182.94]]) - esd(station)float641.01
- long_name :
- Earth-sun distance
- note :
- Calculated based on Spencer (1971), as mean of its values over all time steps.
- units :
- ua
array([1.00959973])
- qc_flag_ghi(time, station)float320.0 0.0 0.0 0.0 0.0 0.0 0.0 0.0 0.0
- standard_name :
- quality_flag
- ancillary_variables :
- ghi
- valid_range :
- [ 0 127]
- flag_masks :
- [ 1 2 4 8 16 32 64]
- flag_values :
- [ 1 2 4 8 16 32 64]
- flag_meanings :
- below_physical_limit above_physical_limit below_rare_limit above_rare_limit comparison_to_low comparison_to_high quality_control_failed
array([[0.], [0.], [0.], [0.], [0.], [0.], [0.], [0.], [0.]], dtype=float32) - qc_flag_gti(time, station)float320.0 0.0 0.0 0.0 0.0 0.0 0.0 0.0 0.0
- standard_name :
- quality_flag
- ancillary_variables :
- gti
- valid_range :
- [ 0 127]
- flag_masks :
- [ 1 2 4 8 16 32 64]
- flag_values :
- [ 1 2 4 8 16 32 64]
- flag_meanings :
- below_physical_limit above_physical_limit below_rare_limit above_rare_limit comparison_to_low comparison_to_high quality_control_failed
array([[0.],
       [0.],
       [0.],
       [0.],
       [0.],
       [0.],
       [0.],
       [0.],
       [0.]], dtype=float32)
- stationPandasIndex
PandasIndex(Index([1.0], dtype='float64', name='station'))
- timePandasIndex
PandasIndex(DatetimeIndex(['2022-08-30 11:21:01', '2022-08-30 11:21:02', '2022-08-30 11:21:03', '2022-08-30 11:21:04', '2022-08-30 11:21:05', '2022-08-30 11:21:06', '2022-08-30 11:21:07', '2022-08-30 11:21:08', '2022-08-30 11:21:09'], dtype='datetime64[ns]', name='time', freq=None)) - maintenancetimePandasIndex
PandasIndex(DatetimeIndex(['2023-05-08 16:09:06'], dtype='datetime64[ns]', name='maintenancetime', freq=None))
- Conventions :
- CF-1.10, ACDD-1.3
- title :
- TROPOS pyranometer network (PyrNet) observational data set
- history :
- 2024-05-31T13:47:06: Generated level l1a by pyrnet version 0.2.11+1.g2c37783.dirty; 2024-05-31T13:47:08: Generated level l1b by pyrnet version 0.2.11+1.g2c37783.dirty;
- institution :
- Leibniz Institute for Tropospheric Research (TROPOS)
- source :
- TROPOS pyranometer network (PyrNet)
- references :
- https://doi.org/10.5194/amt-9-1153-2016
- Department :
- Remote Sensing of Atmospheric Processes
- Department_team :
- Clouds, Aerosol and Radiation
- Address :
- Permoser Str. 15, 04318 Leipzig, Germany
- Contact_person :
- Andreas Macke and the clouds, aerosol and radiation team of the remote sensing department, mailto:andreas.macke@tropos.de
- Contributor_name :
- Contributor_role :
- Authors_software :
- Hartwig Deneke, Jonas Witthuhn, mailto:deneke@tropos.de
- Creator_name :
- Project :
- Standard_name_vocabulary :
- CF Standard Name Table v81
- License :
- CC-BY-SA 3.0
- TESTNOTE :
- This is a test note.
- processing_level :
- l1b
- product_version :
- 0.2.11+1.g2c37783.dirty
- date_created :
- 2024-05-31T13:47:08
- geospatial_lat_min :
- 51.390210333333336
- geospatial_lat_max :
- 51.390210333333336
- geospatial_lat_units :
- degN
- geospatial_lon_min :
- 11.885252
- geospatial_lon_max :
- 11.885252
- geospatial_lon_units :
- degE
- time_coverage_start :
- 2022-08-30T11:21:01
- time_coverage_end :
- 2022-08-30T11:21:09
- time_coverage_duration :
- P0DT0H0M8S
- time_coverage_resolution :
- P0DT0H0M1S
8.4. Function to initialize qc-flag variables:
Show code cell source
Hide code cell source
#|export
#|dropcode
def init_qc_flag(ds, var):
    qc_bits = [2**i for i in range(7)]
    # ds[f"qc_flag_{var}"] = ds[var].copy()
    # ds[f"qc_flag_{var}"] = np.zeros(ds[var].shape).astype(np.ubyte)
    ds = ds.assign({f"qc_flag_{var}": (ds[var].dims, np.zeros(ds[var].shape).astype(np.ubyte))})
    attrs = {
        "standard_name": "quality_flag",
        "ancillary_variables": var,
        "valid_range": [0, np.sum(qc_bits)],
        "flag_masks": qc_bits,
        "flag_values": qc_bits,
        "flag_meanings": str(
            "below_physical_limit" + " " +
            "above_physical_limit" + " " +
            "below_rare_limit" + " " +
            "above_rare_limit" + " " +
            "comparison_to_low" + " " +
            "comparison_to_high" + " "+
            "quality_control_failed"
        )
    }
    ds[f"qc_flag_{var}"].attrs.update(attrs)
    ds[f"qc_flag_{var}"].encoding.update({
        "dtype": "u1",
        "_FillValue": 255,
        "zlib": True
    })

    # update flux var ancillary variables
    if "ancillary_variables" in ds[var].attrs:
        avars = ds[var].attrs["ancillary_variables"] + " "
    else:
        avars = ""
    if f"qc_flag_{var}" not in avars:
        ds[var].attrs.update({"ancillary_variables": avars + f"qc_flag_{var}"})

    return ds

def init_additional_flag(ds, var):
    qc_bits = [2**i for i in range(3)]
    ds = ds.assign({f"add_flag_{var}": (ds[var].dims, np.zeros(ds[var].shape).astype(np.ubyte))})
    attrs = {
        "standard_name": "quality_flag",
        "ancillary_variables": var,
        "valid_range": [0, np.sum(qc_bits)],
        "flag_masks": qc_bits,
        "flag_values": qc_bits,
        "flag_meanings": str(
            "low_outlier" + " " +
            "strong_fluctuation" + " " +
            "not_applicable"
        )
    }
    ds[f"add_flag_{var}"].attrs.update(attrs)
    ds[f"add_flag_{var}"].encoding.update({
        "dtype": "u1",
        "_FillValue": 255,
        "zlib": True
    })

    # update flux var ancillary variables
    if "ancillary_variables" in ds[var].attrs:
        avars = ds[var].attrs["ancillary_variables"] + " "
    else:
        avars = ""
    if f"add_flag_{var}" not in avars:
        ds[var].attrs.update({"ancillary_variables": avars + f"add_flag_{var}"})

    return ds
8.5. Initialize qc-flags for dataset
#|dropout
config = pyrnet.data.get_config()

for var in config["radflux_varname"]:
    ds_l1b = init_qc_flag(ds_l1b, var)
    ds_l1b = init_additional_flag(ds_l1b, var)

ds_l1b
Show code cell output
Hide code cell output
<xarray.Dataset> Size: 1kB
Dimensions:               (station: 1, time: 9, maintenancetime: 1)
Coordinates:
  * station               (station) float64 8B 1.0
  * time                  (time) datetime64[ns] 72B 2022-08-30T11:21:01 ... 2...
  * maintenancetime       (maintenancetime) datetime64[ns] 8B 2023-05-08T16:0...
Data variables: (12/22)
    ghi                   (time, station) float64 72B 280.9 280.9 ... 280.9
    gti                   (time, station) float64 72B 288.9 288.9 ... 289.4
    ta                    (time, station) float64 72B 294.8 294.7 ... 294.8
    rh                    (time, station) float64 72B 0.6253 0.6248 ... 0.629
    battery_voltage       (time, station) float64 72B 6.443 6.445 ... 6.465
    gti_min               (time, station) float64 72B 288.7 288.7 ... 288.7
    ...                    ...
    sazi                  (time, station) float64 72B 182.9 182.9 ... 182.9
    esd                   (station) float64 8B 1.01
    qc_flag_ghi           (time, station) uint8 9B 0 0 0 0 0 0 0 0 0
    qc_flag_gti           (time, station) uint8 9B 0 0 0 0 0 0 0 0 0
    add_flag_ghi          (time, station) uint8 9B 0 0 0 0 0 0 0 0 0
    add_flag_gti          (time, station) uint8 9B 0 0 0 0 0 0 0 0 0
Attributes: (12/31)
    Conventions:               CF-1.10, ACDD-1.3
    title:                     TROPOS pyranometer network (PyrNet) observatio...
    history:                   2024-05-31T13:47:06: Generated level l1a  by p...
    institution:               Leibniz Institute for Tropospheric Research (T...
    source:                    TROPOS pyranometer network (PyrNet)
    references:                https://doi.org/10.5194/amt-9-1153-2016
    ...                        ...
    geospatial_lon_max:        11.885252
    geospatial_lon_units:      degE
    time_coverage_start:       2022-08-30T11:21:01
    time_coverage_end:         2022-08-30T11:21:09
    time_coverage_duration:    P0DT0H0M8S
time_coverage_resolution: P0DT0H0M1S- station: 1
- time: 9
- maintenancetime: 1
- station(station)float641.0
array([1.])
- time(time)datetime64[ns]2022-08-30T11:21:01 ... 2022-08-...
array(['2022-08-30T11:21:01.000000000', '2022-08-30T11:21:02.000000000', '2022-08-30T11:21:03.000000000', '2022-08-30T11:21:04.000000000', '2022-08-30T11:21:05.000000000', '2022-08-30T11:21:06.000000000', '2022-08-30T11:21:07.000000000', '2022-08-30T11:21:08.000000000', '2022-08-30T11:21:09.000000000'], dtype='datetime64[ns]') - maintenancetime(maintenancetime)datetime64[ns]2023-05-08T16:09:06
array(['2023-05-08T16:09:06.000000000'], dtype='datetime64[ns]')
- ghi(time, station)float64280.9 280.9 280.9 ... 280.9 280.9
- units :
- W m-2
- long_name :
- downwelling shortwave flux
- standard_name :
- downwelling_shortwave_flux_in_air
- valid_range :
- [ 0 60000]
- ancillary_variables :
- maintenance_flag_ghi qc_flag_ghi add_flag_ghi
- serial :
- S12128.001
- calibration_Cabsolute :
- 129366.10608020698
- calibration_Ccoscorr :
- 1.45 - 3.04·x¹ + 5.59·x² - 3.01·x³
- calibration_function :
- flux (W m-2) = flux (V) * Cabsolute (W m-2 V-1) * Ccoscorr(mua)
array([[280.9 ], [280.9 ], [280.9 ], [280.75], [280.9 ], [280.9 ], [280.75], [280.9 ], [280.9 ]]) - gti(time, station)float64288.9 288.9 288.7 ... 288.7 289.4
- units :
- W m-2
- long_name :
- downwelling shortwave flux measured on secondary platform, might be tilted
- standard_name :
- downwelling_shortwave_flux_in_air
- valid_range :
- [ 0 60000]
- ancillary_variables :
- maintenance_flag_gti qc_flag_gti add_flag_gti
- hangle :
- 0.0
- vangle :
- 0.0
- serial :
- S12137.049
- calibration_Cabsolute :
- 143266.47564469912
- calibration_Ccoscorr :
- 1.45 - 3.04·x¹ + 5.59·x² - 3.01·x³
- calibration_function :
- flux (W m-2) = flux (V) * Cabsolute (W m-2 V-1) * Ccoscorr(mua)
array([[288.95 ], [288.95 ], [288.65 ], [288.65 ], [288.8 ], [288.65 ], [288.325], [288.65 ], [289.45 ]]) - ta(time, station)float64294.8 294.7 294.8 ... 294.7 294.8
- units :
- K
- long_name :
- air temperature
- standard_name :
- air_temperature
- valid_range :
- [ 0 10000]
array([[294.8 ], [294.74], [294.77], [294.75], [294.79], [294.75], [294.81], [294.73], [294.76]]) - rh(time, station)float640.6253 0.6248 ... 0.628 0.629
- units :
- 1
- long_name :
- air relative humidity
- standard_name :
- relative_humidity
- valid_range :
- [ 0 10000]
array([[0.6253], [0.6248], [0.6259], [0.6266], [0.6271], [0.6271], [0.6286], [0.628 ], [0.629 ]]) - battery_voltage(time, station)float646.443 6.445 6.444 ... 6.449 6.465
- units :
- V
- standard_name :
- battery_voltage
- valid_range :
- [ 0 6400]
array([[6.443], [6.445], [6.444], [6.446], [6.45 ], [6.448], [6.446], [6.449], [6.465]]) - gti_min(time, station)float64288.7 288.7 288.7 ... 288.7 288.7
- units :
- W m-2
- long_name :
- downwelling shortwave flux measured on secondary platform, might be tilted
- standard_name :
- min_downwelling_shortwave_flux_in_air
- valid_range :
- [ 0 60000]
- ancillary_variables :
- maintenance_flag_gti
- hangle :
- 0.0
- vangle :
- 0.0
- serial :
- S12137.049
- calibration_Cabsolute :
- 143266.47564469912
- calibration_Ccoscorr :
- 1.45 - 3.04·x¹ + 5.59·x² - 3.01·x³
- calibration_function :
- flux (W m-2) = flux (V) * Cabsolute (W m-2 V-1) * Ccoscorr(mua)
array([[288.65 ], [288.65 ], [288.65 ], [287.025], [287.025], [288.65 ], [287.025], [288.65 ], [288.65 ]]) - ghi_min(time, station)float64280.9 280.9 280.9 ... 280.9 280.9
- units :
- W m-2
- long_name :
- downwelling shortwave flux
- standard_name :
- min_downwelling_shortwave_flux_in_air
- valid_range :
- [ 0 60000]
- ancillary_variables :
- maintenance_flag_ghi
- serial :
- S12128.001
- calibration_Cabsolute :
- 129366.10608020698
- calibration_Ccoscorr :
- 1.45 - 3.04·x¹ + 5.59·x² - 3.01·x³
- calibration_function :
- flux (W m-2) = flux (V) * Cabsolute (W m-2 V-1) * Ccoscorr(mua)
array([[280.9 ], [280.9 ], [280.9 ], [279.45], [280.9 ], [280.9 ], [279.45], [280.9 ], [280.9 ]]) - gti_max(time, station)float64290.2 290.2 288.7 ... 288.7 290.2
- units :
- W m-2
- long_name :
- downwelling shortwave flux measured on secondary platform, might be tilted
- standard_name :
- max_downwelling_shortwave_flux_in_air
- valid_range :
- [ 0 60000]
- ancillary_variables :
- maintenance_flag_gti
- hangle :
- 0.0
- vangle :
- 0.0
- serial :
- S12137.049
- calibration_Cabsolute :
- 143266.47564469912
- calibration_Ccoscorr :
- 1.45 - 3.04·x¹ + 5.59·x² - 3.01·x³
- calibration_function :
- flux (W m-2) = flux (V) * Cabsolute (W m-2 V-1) * Ccoscorr(mua)
array([[290.25], [290.25], [288.65], [290.25], [290.25], [288.65], [288.65], [288.65], [290.25]]) - ghi_max(time, station)float64280.9 280.9 280.9 ... 280.9 280.9
- units :
- W m-2
- long_name :
- downwelling shortwave flux
- standard_name :
- max_downwelling_shortwave_flux_in_air
- valid_range :
- [ 0 60000]
- ancillary_variables :
- maintenance_flag_ghi
- serial :
- S12128.001
- calibration_Cabsolute :
- 129366.10608020698
- calibration_Ccoscorr :
- 1.45 - 3.04·x¹ + 5.59·x² - 3.01·x³
- calibration_function :
- flux (W m-2) = flux (V) * Cabsolute (W m-2 V-1) * Ccoscorr(mua)
array([[280.9], [280.9], [280.9], [280.9], [280.9], [280.9], [280.9], [280.9], [280.9]]) - gti_std(time, station)float640.725 0.675 0.0 ... 0.675 0.0 1.125
- units :
- W m-2
- long_name :
- downwelling shortwave flux measured on secondary platform, might be tilted
- standard_name :
- std_downwelling_shortwave_flux_in_air
- valid_range :
- [ 0 60000]
- ancillary_variables :
- maintenance_flag_gti
- hangle :
- 0.0
- vangle :
- 0.0
- serial :
- S12137.049
- calibration_Cabsolute :
- 143266.47564469912
- calibration_Ccoscorr :
- 1.45 - 3.04·x¹ + 5.59·x² - 3.01·x³
- calibration_function :
- flux (W m-2) = flux (V) * Cabsolute (W m-2 V-1) * Ccoscorr(mua)
array([[0.725], [0.675], [0. ], [0.75 ], [0.9 ], [0. ], [0.675], [0. ], [1.125]]) - ghi_std(time, station)float640.0 0.0 0.0 0.45 ... 0.45 0.0 0.0
- units :
- W m-2
- long_name :
- downwelling shortwave flux
- standard_name :
- std_downwelling_shortwave_flux_in_air
- valid_range :
- [ 0 60000]
- ancillary_variables :
- maintenance_flag_ghi
- serial :
- S12128.001
- calibration_Cabsolute :
- 129366.10608020698
- calibration_Ccoscorr :
- 1.45 - 3.04·x¹ + 5.59·x² - 3.01·x³
- calibration_function :
- flux (W m-2) = flux (V) * Cabsolute (W m-2 V-1) * Ccoscorr(mua)
array([[0. ], [0. ], [0. ], [0.45], [0. ], [0. ], [0.45], [0. ], [0. ]]) - lat(station)float6451.39
- standard_name :
- latitude
- units :
- degree_north
- valid_range :
- [-90. 90.]
array([51.39021033])
- lon(station)float6411.89
- standard_name :
- longitude
- units :
- degree_east
- valid_range :
- [-180. 180.]
array([11.885252])
- maintenance_flag_ghi(maintenancetime, station)float329.0
- standard_name :
- quality_flag
- long_name :
- Maintenance quality control flags
- note :
- Soiling describes subjectively the coverage of the pyranometer dome with dirt. The level flag is problematic if the bubble of the spirit level touches the reference ring, and bad if it is outside.
- valid_range :
- [ 0 11]
- flag_masks :
- [ 3 3 3 12 12]
- flag_values :
- [1 2 3 4 8]
- flag_meanings :
- soiling_light soiling_moderate soiling_heavy level_problematic level_bad
- note_general :
- 222
- note_clean :
- testing notes
- note_level :
- test
array([[9.]], dtype=float32)
- maintenance_flag_gti(maintenancetime, station)float327.0
- standard_name :
- quality_flag
- long_name :
- Maintenance quality control flags
- note :
- Soiling describes subjectively the coverage of the pyranometer dome with dirt. The level flag is problematic if the bubble of the spirit level touches the reference ring, and bad if it is outside.
- valid_range :
- [ 0 11]
- flag_masks :
- [ 3 3 3 12 12]
- flag_values :
- [1 2 3 4 8]
- flag_meanings :
- soiling_light soiling_moderate soiling_heavy level_problematic level_bad
- note_general :
- 222
- note_clean :
- note_level :
array([[7.]], dtype=float32)
- szen(time, station)float6442.51 42.51 42.51 ... 42.51 42.51
- standard_name :
- solar_zenith_angle
- units :
- degree
- valid_range :
- [ 0 36000]
array([[42.51], [42.51], [42.51], [42.51], [42.51], [42.51], [42.51], [42.51], [42.51]]) - sazi(time, station)float64182.9 182.9 182.9 ... 182.9 182.9
- standard_name :
- solar_azimuth_angle
- units :
- degree
- valid_range :
- [ 0 36000]
array([[182.89], [182.9 ], [182.91], [182.91], [182.92], [182.93], [182.93], [182.94], [182.94]]) - esd(station)float641.01
- long_name :
- Earth-sun distance
- note :
- Calculated based on Spencer (1971), as mean of its values over all time steps.
- units :
- ua
array([1.00959973])
- qc_flag_ghi(time, station)uint80 0 0 0 0 0 0 0 0
- standard_name :
- quality_flag
- ancillary_variables :
- ghi
- valid_range :
- [0, np.int64(127)]
- flag_masks :
- [1, 2, 4, 8, 16, 32, 64]
- flag_values :
- [1, 2, 4, 8, 16, 32, 64]
- flag_meanings :
- below_physical_limit above_physical_limit below_rare_limit above_rare_limit comparison_to_low comparison_to_high quality_control_failed
array([[0], [0], [0], [0], [0], [0], [0], [0], [0]], dtype=uint8) - qc_flag_gti(time, station)uint80 0 0 0 0 0 0 0 0
- standard_name :
- quality_flag
- ancillary_variables :
- gti
- valid_range :
- [0, np.int64(127)]
- flag_masks :
- [1, 2, 4, 8, 16, 32, 64]
- flag_values :
- [1, 2, 4, 8, 16, 32, 64]
- flag_meanings :
- below_physical_limit above_physical_limit below_rare_limit above_rare_limit comparison_to_low comparison_to_high quality_control_failed
array([[0], [0], [0], [0], [0], [0], [0], [0], [0]], dtype=uint8) - add_flag_ghi(time, station)uint80 0 0 0 0 0 0 0 0
- standard_name :
- quality_flag
- ancillary_variables :
- ghi
- valid_range :
- [0, np.int64(7)]
- flag_masks :
- [1, 2, 4]
- flag_values :
- [1, 2, 4]
- flag_meanings :
- low_outlier strong_fluctuation not_applicable
array([[0], [0], [0], [0], [0], [0], [0], [0], [0]], dtype=uint8) - add_flag_gti(time, station)uint80 0 0 0 0 0 0 0 0
- standard_name :
- quality_flag
- ancillary_variables :
- gti
- valid_range :
- [0, np.int64(7)]
- flag_masks :
- [1, 2, 4]
- flag_values :
- [1, 2, 4]
- flag_meanings :
- low_outlier strong_fluctuation not_applicable
array([[0],
       [0],
       [0],
       [0],
       [0],
       [0],
       [0],
       [0],
       [0]], dtype=uint8)
- stationPandasIndex
PandasIndex(Index([1.0], dtype='float64', name='station'))
- timePandasIndex
PandasIndex(DatetimeIndex(['2022-08-30 11:21:01', '2022-08-30 11:21:02', '2022-08-30 11:21:03', '2022-08-30 11:21:04', '2022-08-30 11:21:05', '2022-08-30 11:21:06', '2022-08-30 11:21:07', '2022-08-30 11:21:08', '2022-08-30 11:21:09'], dtype='datetime64[ns]', name='time', freq=None)) - maintenancetimePandasIndex
PandasIndex(DatetimeIndex(['2023-05-08 16:09:06'], dtype='datetime64[ns]', name='maintenancetime', freq=None))
- Conventions :
- CF-1.10, ACDD-1.3
- title :
- TROPOS pyranometer network (PyrNet) observational data set
- history :
- 2024-05-31T13:47:06: Generated level l1a by pyrnet version 0.2.11+1.g2c37783.dirty; 2024-05-31T13:47:08: Generated level l1b by pyrnet version 0.2.11+1.g2c37783.dirty;
- institution :
- Leibniz Institute for Tropospheric Research (TROPOS)
- source :
- TROPOS pyranometer network (PyrNet)
- references :
- https://doi.org/10.5194/amt-9-1153-2016
- Department :
- Remote Sensing of Atmospheric Processes
- Department_team :
- Clouds, Aerosol and Radiation
- Address :
- Permoser Str. 15, 04318 Leipzig, Germany
- Contact_person :
- Andreas Macke and the clouds, aerosol and radiation team of the remote sensing department, mailto:andreas.macke@tropos.de
- Contributor_name :
- Contributor_role :
- Authors_software :
- Hartwig Deneke, Jonas Witthuhn, mailto:deneke@tropos.de
- Creator_name :
- Project :
- Standard_name_vocabulary :
- CF Standard Name Table v81
- License :
- CC-BY-SA 3.0
- TESTNOTE :
- This is a test note.
- processing_level :
- l1b
- product_version :
- 0.2.11+1.g2c37783.dirty
- date_created :
- 2024-05-31T13:47:08
- geospatial_lat_min :
- 51.390210333333336
- geospatial_lat_max :
- 51.390210333333336
- geospatial_lat_units :
- degN
- geospatial_lon_min :
- 11.885252
- geospatial_lon_max :
- 11.885252
- geospatial_lon_units :
- degE
- time_coverage_start :
- 2022-08-30T11:21:01
- time_coverage_end :
- 2022-08-30T11:21:09
- time_coverage_duration :
- P0DT0H0M8S
- time_coverage_resolution :
- P0DT0H0M1S
8.6. Prepare ancillary variables
szen = ds_l1b.szen.values
mu0 = np.cos(np.deg2rad(szen))
mu0[mu0 < 0] = 0 #  exclude night
esd = ds_l1b.esd.values
Sa = CONSTANTS.S0 / esd**2
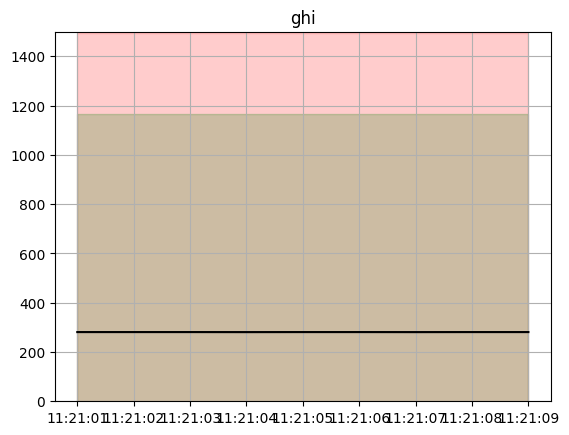
8.7. Perform quality checks on GHI (main pyranometer) and GTI (extra pyranometer).
Check if GTI is tilted and if so, apply a simple conversion to horizontal irradiance for the quality checks.
Show code cell source
Hide code cell source
#|dropcode
#|dropout
dsr = ds_l1b.copy()
dsr = dsr.drop_vars([var for var in dsr if var not in config["radflux_varname"]])
for var in config["radflux_varname"]:
is_tilted = pyrnet.utils.check_tilted(ds_l1b[var])
values = ds_l1b[var].values.copy()
# apply correction if possible
if np.any(is_tilted):
vangle = pyrnet.utils.make_iter(ds_l1b[var].attrs["vangle"])
hangle = pyrnet.utils.make_iter(ds_l1b[var].attrs["hangle"])
cfac = pyrnet.utils.tilt_correction_factor(
dp = vangle,
dy = hangle,
szen=ds_l1b.szen.values,
sazi=ds_l1b.sazi.values
)
mask = is_tilted[None,:] * np.isnan(cfac)
ds_l1b[f"qc_flag_{var}"].values[mask] += QCCode.quality_control_failed
apply_correction = is_tilted[None,:] * ~np.isnan(cfac)
values[apply_correction] *= cfac[apply_correction]
# update radflux collection dataset
dsr[var].values = values
# physical minimum
mask = values < -4
ds_l1b[f"qc_flag_{var}"].values[mask] += QCCode.below_physical
# physical maximum
mask = values > ((Sa * 1.5 * mu0 ** 1.2) + 100)
ds_l1b[f"qc_flag_{var}"].values[mask] += QCCode.above_phyiscal
# rare limit minimum
mask = values < -2
ds_l1b[f"qc_flag_{var}"].values[mask] += QCCode.below_rare
# rare limit maximum
mask = values > ((Sa * 1.2 * mu0 ** 1.2) + 50)
ds_l1b[f"qc_flag_{var}"].values[mask] += QCCode.above_rare
fig,ax = plt.subplots(1,1)
ax.set_title(var)
ax.fill_between(ds_l1b.time,np.ones(mu0.shape[0])*-4,((Sa * 1.5 * mu0 ** 1.2) + 100)[:,0],color='r',alpha=0.2)
ax.fill_between(ds_l1b.time,np.ones(mu0.shape[0])*-2,((Sa * 1.2 * mu0 ** 1.2) + 50)[:,0],color='g',alpha=0.2)
ax.plot(ds_l1b.time,ds_l1b[var].values,'grey')
ax.plot(ds_l1b.time,values, 'k')
ax.set_ylim([0,1500])
ax.grid(True)
# compare all sensors from network, or single station
# dsr = dsr.where(np.abs(np.diff(dsr.ghi.values, axis=0, prepend=0)) < 5)
# dsr = dsr.resample(time="120min",skipna=True).mean()
window = 30*60
if dsr.time.size<window:
window = dsr.time.size
dsrrolling = dsr.rolling(time=window)
dsr = dsrrolling.mean(skipna=True)
dsrmin = dsrrolling.min(skipna=True)
dsrmax = dsrrolling.max(skipna=True)
dsr = dsr.where(dsrmin.ghi>0.8*dsrmax.ghi)
thres_low = np.ones(ds_l1b.time.size)*0.9
thres_high = np.ones(ds_l1b.time.size)*1.1
thres_low[ds_l1b.szen.mean("station")>75] = 0.85
thres_high[ds_l1b.szen.mean("station")>75] = 1.15
all_values_tilted_flag = np.concatenate([pyrnet.utils.check_tilted(dsr[var]) for var in dsr],axis=0)
all_values = np.concatenate([dsr[var].values for var in dsr],axis=1)
all_values_mean_no_tilt = np.nanmean(all_values[:,~all_values_tilted_flag],axis=1)
all_values_mean_tilt = np.nanmean(all_values[:,all_values_tilted_flag],axis=1)
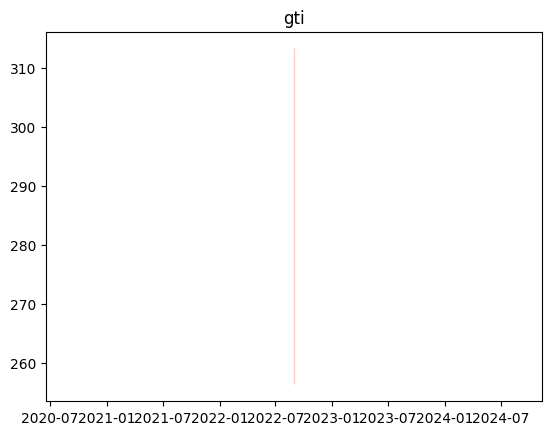
for var in config["radflux_varname"]:
is_tilted = pyrnet.utils.check_tilted(ds_l1b[var])
meanvalues = np.repeat(all_values_mean_no_tilt[:,None],dsr[var].shape[1],axis=1)
meanvalues[:,is_tilted] = all_values_mean_tilt[:,None]
ratio = np.ones(dsr[var].shape)
ratio[meanvalues>50] = dsr[var].values[meanvalues>50] / meanvalues[meanvalues>50]
fig,ax = plt.subplots(1,1)
ax.set_title(var)
ax.plot(dsr.time,dsr[var].values,'grey')
ax.fill_between(dsr.time,all_values_mean_no_tilt*0.9,all_values_mean_no_tilt*1.1,color='r',alpha=0.2)
ax.plot(dsr.time,meanvalues,'k')
# reindex ratio to original resolution
dsr = dsr.assign({"ratio": (("time","station"), ratio)})
ratio = dsr.ratio.reindex_like(ds_l1b, method='nearest').values
dsr = dsr.drop_vars(["ratio"])
# comparison to low
mask = ratio < thres_low[:,None]
ds_l1b[f"qc_flag_{var}"].values[mask] += QCCode.compare_to_low
# comparison to high
mask = ratio > thres_high[:,None]
ds_l1b[f"qc_flag_{var}"].values[mask] += QCCode.compare_to_high
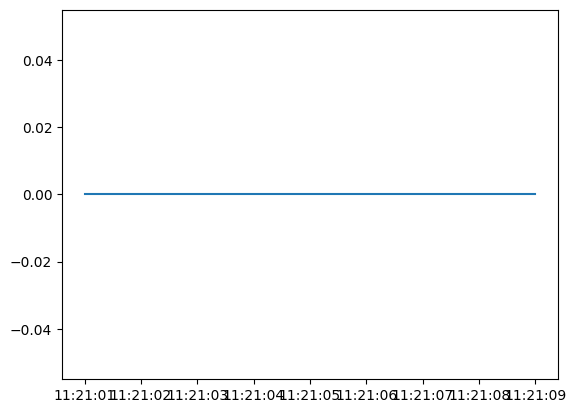
fig,ax = plt.subplots(1,1)
ax.plot(ds_l1b.time,ds_l1b.qc_flag_ghi)
ds_l1b
Show code cell output
Hide code cell output
C:\Users\witthuhn\AppData\Local\Temp\ipykernel_16388\4238324457.py:66: RuntimeWarning: Mean of empty slice
  all_values_mean_no_tilt = np.nanmean(all_values[:,~all_values_tilted_flag],axis=1)
C:\Users\witthuhn\AppData\Local\Temp\ipykernel_16388\4238324457.py:67: RuntimeWarning: Mean of empty slice
  all_values_mean_tilt = np.nanmean(all_values[:,all_values_tilted_flag],axis=1)
<xarray.Dataset> Size: 1kB
Dimensions:               (station: 1, time: 9, maintenancetime: 1)
Coordinates:
  * station               (station) float64 8B 1.0
  * time                  (time) datetime64[ns] 72B 2022-08-30T11:21:01 ... 2...
  * maintenancetime       (maintenancetime) datetime64[ns] 8B 2023-05-08T16:0...
Data variables: (12/22)
    ghi                   (time, station) float64 72B 280.9 280.9 ... 280.9
    gti                   (time, station) float64 72B 288.9 288.9 ... 289.4
    ta                    (time, station) float64 72B 294.8 294.7 ... 294.8
    rh                    (time, station) float64 72B 0.6253 0.6248 ... 0.629
    battery_voltage       (time, station) float64 72B 6.443 6.445 ... 6.465
    gti_min               (time, station) float64 72B 288.7 288.7 ... 288.7
    ...                    ...
    sazi                  (time, station) float64 72B 182.9 182.9 ... 182.9
    esd                   (station) float64 8B 1.01
    qc_flag_ghi           (time, station) uint8 9B 0 0 0 0 0 0 0 0 0
    qc_flag_gti           (time, station) uint8 9B 0 0 0 0 0 0 0 0 0
    add_flag_ghi          (time, station) uint8 9B 0 0 0 0 0 0 0 0 0
    add_flag_gti          (time, station) uint8 9B 0 0 0 0 0 0 0 0 0
Attributes: (12/31)
    Conventions:               CF-1.10, ACDD-1.3
    title:                     TROPOS pyranometer network (PyrNet) observatio...
    history:                   2024-05-31T13:47:06: Generated level l1a  by p...
    institution:               Leibniz Institute for Tropospheric Research (T...
    source:                    TROPOS pyranometer network (PyrNet)
    references:                https://doi.org/10.5194/amt-9-1153-2016
    ...                        ...
    geospatial_lon_max:        11.885252
    geospatial_lon_units:      degE
    time_coverage_start:       2022-08-30T11:21:01
    time_coverage_end:         2022-08-30T11:21:09
    time_coverage_duration:    P0DT0H0M8S
time_coverage_resolution: P0DT0H0M1S- station: 1
- time: 9
- maintenancetime: 1
- station(station)float641.0
array([1.])
- time(time)datetime64[ns]2022-08-30T11:21:01 ... 2022-08-...
array(['2022-08-30T11:21:01.000000000', '2022-08-30T11:21:02.000000000', '2022-08-30T11:21:03.000000000', '2022-08-30T11:21:04.000000000', '2022-08-30T11:21:05.000000000', '2022-08-30T11:21:06.000000000', '2022-08-30T11:21:07.000000000', '2022-08-30T11:21:08.000000000', '2022-08-30T11:21:09.000000000'], dtype='datetime64[ns]') - maintenancetime(maintenancetime)datetime64[ns]2023-05-08T16:09:06
array(['2023-05-08T16:09:06.000000000'], dtype='datetime64[ns]')
- ghi(time, station)float64280.9 280.9 280.9 ... 280.9 280.9
- units :
- W m-2
- long_name :
- downwelling shortwave flux
- standard_name :
- downwelling_shortwave_flux_in_air
- valid_range :
- [ 0 60000]
- ancillary_variables :
- maintenance_flag_ghi qc_flag_ghi add_flag_ghi
- serial :
- S12128.001
- calibration_Cabsolute :
- 129366.10608020698
- calibration_Ccoscorr :
- 1.45 - 3.04·x¹ + 5.59·x² - 3.01·x³
- calibration_function :
- flux (W m-2) = flux (V) * Cabsolute (W m-2 V-1) * Ccoscorr(mua)
array([[280.9 ], [280.9 ], [280.9 ], [280.75], [280.9 ], [280.9 ], [280.75], [280.9 ], [280.9 ]]) - gti(time, station)float64288.9 288.9 288.7 ... 288.7 289.4
- units :
- W m-2
- long_name :
- downwelling shortwave flux measured on secondary platform, might be tilted
- standard_name :
- downwelling_shortwave_flux_in_air
- valid_range :
- [ 0 60000]
- ancillary_variables :
- maintenance_flag_gti qc_flag_gti add_flag_gti
- hangle :
- 0.0
- vangle :
- 0.0
- serial :
- S12137.049
- calibration_Cabsolute :
- 143266.47564469912
- calibration_Ccoscorr :
- 1.45 - 3.04·x¹ + 5.59·x² - 3.01·x³
- calibration_function :
- flux (W m-2) = flux (V) * Cabsolute (W m-2 V-1) * Ccoscorr(mua)
array([[288.95 ], [288.95 ], [288.65 ], [288.65 ], [288.8 ], [288.65 ], [288.325], [288.65 ], [289.45 ]]) - ta(time, station)float64294.8 294.7 294.8 ... 294.7 294.8
- units :
- K
- long_name :
- air temperature
- standard_name :
- air_temperature
- valid_range :
- [ 0 10000]
array([[294.8 ], [294.74], [294.77], [294.75], [294.79], [294.75], [294.81], [294.73], [294.76]]) - rh(time, station)float640.6253 0.6248 ... 0.628 0.629
- units :
- 1
- long_name :
- air relative humidity
- standard_name :
- relative_humidity
- valid_range :
- [ 0 10000]
array([[0.6253], [0.6248], [0.6259], [0.6266], [0.6271], [0.6271], [0.6286], [0.628 ], [0.629 ]]) - battery_voltage(time, station)float646.443 6.445 6.444 ... 6.449 6.465
- units :
- V
- standard_name :
- battery_voltage
- valid_range :
- [ 0 6400]
array([[6.443], [6.445], [6.444], [6.446], [6.45 ], [6.448], [6.446], [6.449], [6.465]]) - gti_min(time, station)float64288.7 288.7 288.7 ... 288.7 288.7
- units :
- W m-2
- long_name :
- downwelling shortwave flux measured on secondary platform, might be tilted
- standard_name :
- min_downwelling_shortwave_flux_in_air
- valid_range :
- [ 0 60000]
- ancillary_variables :
- maintenance_flag_gti
- hangle :
- 0.0
- vangle :
- 0.0
- serial :
- S12137.049
- calibration_Cabsolute :
- 143266.47564469912
- calibration_Ccoscorr :
- 1.45 - 3.04·x¹ + 5.59·x² - 3.01·x³
- calibration_function :
- flux (W m-2) = flux (V) * Cabsolute (W m-2 V-1) * Ccoscorr(mua)
array([[288.65 ], [288.65 ], [288.65 ], [287.025], [287.025], [288.65 ], [287.025], [288.65 ], [288.65 ]]) - ghi_min(time, station)float64280.9 280.9 280.9 ... 280.9 280.9
- units :
- W m-2
- long_name :
- downwelling shortwave flux
- standard_name :
- min_downwelling_shortwave_flux_in_air
- valid_range :
- [ 0 60000]
- ancillary_variables :
- maintenance_flag_ghi
- serial :
- S12128.001
- calibration_Cabsolute :
- 129366.10608020698
- calibration_Ccoscorr :
- 1.45 - 3.04·x¹ + 5.59·x² - 3.01·x³
- calibration_function :
- flux (W m-2) = flux (V) * Cabsolute (W m-2 V-1) * Ccoscorr(mua)
array([[280.9 ], [280.9 ], [280.9 ], [279.45], [280.9 ], [280.9 ], [279.45], [280.9 ], [280.9 ]]) - gti_max(time, station)float64290.2 290.2 288.7 ... 288.7 290.2
- units :
- W m-2
- long_name :
- downwelling shortwave flux measured on secondary platform, might be tilted
- standard_name :
- max_downwelling_shortwave_flux_in_air
- valid_range :
- [ 0 60000]
- ancillary_variables :
- maintenance_flag_gti
- hangle :
- 0.0
- vangle :
- 0.0
- serial :
- S12137.049
- calibration_Cabsolute :
- 143266.47564469912
- calibration_Ccoscorr :
- 1.45 - 3.04·x¹ + 5.59·x² - 3.01·x³
- calibration_function :
- flux (W m-2) = flux (V) * Cabsolute (W m-2 V-1) * Ccoscorr(mua)
array([[290.25], [290.25], [288.65], [290.25], [290.25], [288.65], [288.65], [288.65], [290.25]]) - ghi_max(time, station)float64280.9 280.9 280.9 ... 280.9 280.9
- units :
- W m-2
- long_name :
- downwelling shortwave flux
- standard_name :
- max_downwelling_shortwave_flux_in_air
- valid_range :
- [ 0 60000]
- ancillary_variables :
- maintenance_flag_ghi
- serial :
- S12128.001
- calibration_Cabsolute :
- 129366.10608020698
- calibration_Ccoscorr :
- 1.45 - 3.04·x¹ + 5.59·x² - 3.01·x³
- calibration_function :
- flux (W m-2) = flux (V) * Cabsolute (W m-2 V-1) * Ccoscorr(mua)
array([[280.9], [280.9], [280.9], [280.9], [280.9], [280.9], [280.9], [280.9], [280.9]]) - gti_std(time, station)float640.725 0.675 0.0 ... 0.675 0.0 1.125
- units :
- W m-2
- long_name :
- downwelling shortwave flux measured on secondary platform, might be tilted
- standard_name :
- std_downwelling_shortwave_flux_in_air
- valid_range :
- [ 0 60000]
- ancillary_variables :
- maintenance_flag_gti
- hangle :
- 0.0
- vangle :
- 0.0
- serial :
- S12137.049
- calibration_Cabsolute :
- 143266.47564469912
- calibration_Ccoscorr :
- 1.45 - 3.04·x¹ + 5.59·x² - 3.01·x³
- calibration_function :
- flux (W m-2) = flux (V) * Cabsolute (W m-2 V-1) * Ccoscorr(mua)
array([[0.725], [0.675], [0. ], [0.75 ], [0.9 ], [0. ], [0.675], [0. ], [1.125]]) - ghi_std(time, station)float640.0 0.0 0.0 0.45 ... 0.45 0.0 0.0
- units :
- W m-2
- long_name :
- downwelling shortwave flux
- standard_name :
- std_downwelling_shortwave_flux_in_air
- valid_range :
- [ 0 60000]
- ancillary_variables :
- maintenance_flag_ghi
- serial :
- S12128.001
- calibration_Cabsolute :
- 129366.10608020698
- calibration_Ccoscorr :
- 1.45 - 3.04·x¹ + 5.59·x² - 3.01·x³
- calibration_function :
- flux (W m-2) = flux (V) * Cabsolute (W m-2 V-1) * Ccoscorr(mua)
array([[0. ], [0. ], [0. ], [0.45], [0. ], [0. ], [0.45], [0. ], [0. ]]) - lat(station)float6451.39
- standard_name :
- latitude
- units :
- degree_north
- valid_range :
- [-90. 90.]
array([51.39021033])
- lon(station)float6411.89
- standard_name :
- longitude
- units :
- degree_east
- valid_range :
- [-180. 180.]
array([11.885252])
- maintenance_flag_ghi(maintenancetime, station)float329.0
- standard_name :
- quality_flag
- long_name :
- Maintenance quality control flags
- note :
- Soiling describes subjectively the coverage of the pyranometer dome with dirt. The level flag is problematic if the bubble of the spirit level touches the reference ring, and bad if it is outside.
- valid_range :
- [ 0 11]
- flag_masks :
- [ 3 3 3 12 12]
- flag_values :
- [1 2 3 4 8]
- flag_meanings :
- soiling_light soiling_moderate soiling_heavy level_problematic level_bad
- note_general :
- 222
- note_clean :
- testing notes
- note_level :
- test
array([[9.]], dtype=float32)
- maintenance_flag_gti(maintenancetime, station)float327.0
- standard_name :
- quality_flag
- long_name :
- Maintenance quality control flags
- note :
- Soiling describes subjectively the coverage of the pyranometer dome with dirt. The level flag is problematic if the bubble of the spirit level touches the reference ring, and bad if it is outside.
- valid_range :
- [ 0 11]
- flag_masks :
- [ 3 3 3 12 12]
- flag_values :
- [1 2 3 4 8]
- flag_meanings :
- soiling_light soiling_moderate soiling_heavy level_problematic level_bad
- note_general :
- 222
- note_clean :
- note_level :
array([[7.]], dtype=float32)
- szen(time, station)float6442.51 42.51 42.51 ... 42.51 42.51
- standard_name :
- solar_zenith_angle
- units :
- degree
- valid_range :
- [ 0 36000]
array([[42.51], [42.51], [42.51], [42.51], [42.51], [42.51], [42.51], [42.51], [42.51]]) - sazi(time, station)float64182.9 182.9 182.9 ... 182.9 182.9
- standard_name :
- solar_azimuth_angle
- units :
- degree
- valid_range :
- [ 0 36000]
array([[182.89], [182.9 ], [182.91], [182.91], [182.92], [182.93], [182.93], [182.94], [182.94]]) - esd(station)float641.01
- long_name :
- Earth-sun distance
- note :
- Calculated based on Spencer (1971), as mean of its values over all time steps.
- units :
- ua
array([1.00959973])
- qc_flag_ghi(time, station)uint80 0 0 0 0 0 0 0 0
- standard_name :
- quality_flag
- ancillary_variables :
- ghi
- valid_range :
- [0, np.int64(127)]
- flag_masks :
- [1, 2, 4, 8, 16, 32, 64]
- flag_values :
- [1, 2, 4, 8, 16, 32, 64]
- flag_meanings :
- below_physical_limit above_physical_limit below_rare_limit above_rare_limit comparison_to_low comparison_to_high quality_control_failed
array([[0], [0], [0], [0], [0], [0], [0], [0], [0]], dtype=uint8) - qc_flag_gti(time, station)uint80 0 0 0 0 0 0 0 0
- standard_name :
- quality_flag
- ancillary_variables :
- gti
- valid_range :
- [0, np.int64(127)]
- flag_masks :
- [1, 2, 4, 8, 16, 32, 64]
- flag_values :
- [1, 2, 4, 8, 16, 32, 64]
- flag_meanings :
- below_physical_limit above_physical_limit below_rare_limit above_rare_limit comparison_to_low comparison_to_high quality_control_failed
array([[0], [0], [0], [0], [0], [0], [0], [0], [0]], dtype=uint8) - add_flag_ghi(time, station)uint80 0 0 0 0 0 0 0 0
- standard_name :
- quality_flag
- ancillary_variables :
- ghi
- valid_range :
- [0, np.int64(7)]
- flag_masks :
- [1, 2, 4]
- flag_values :
- [1, 2, 4]
- flag_meanings :
- low_outlier strong_fluctuation not_applicable
array([[0], [0], [0], [0], [0], [0], [0], [0], [0]], dtype=uint8) - add_flag_gti(time, station)uint80 0 0 0 0 0 0 0 0
- standard_name :
- quality_flag
- ancillary_variables :
- gti
- valid_range :
- [0, np.int64(7)]
- flag_masks :
- [1, 2, 4]
- flag_values :
- [1, 2, 4]
- flag_meanings :
- low_outlier strong_fluctuation not_applicable
array([[0],
       [0],
       [0],
       [0],
       [0],
       [0],
       [0],
       [0],
       [0]], dtype=uint8)
- stationPandasIndex
PandasIndex(Index([1.0], dtype='float64', name='station'))
- timePandasIndex
PandasIndex(DatetimeIndex(['2022-08-30 11:21:01', '2022-08-30 11:21:02', '2022-08-30 11:21:03', '2022-08-30 11:21:04', '2022-08-30 11:21:05', '2022-08-30 11:21:06', '2022-08-30 11:21:07', '2022-08-30 11:21:08', '2022-08-30 11:21:09'], dtype='datetime64[ns]', name='time', freq=None)) - maintenancetimePandasIndex
PandasIndex(DatetimeIndex(['2023-05-08 16:09:06'], dtype='datetime64[ns]', name='maintenancetime', freq=None))
- Conventions :
- CF-1.10, ACDD-1.3
- title :
- TROPOS pyranometer network (PyrNet) observational data set
- history :
- 2024-05-31T13:47:06: Generated level l1a by pyrnet version 0.2.11+1.g2c37783.dirty; 2024-05-31T13:47:08: Generated level l1b by pyrnet version 0.2.11+1.g2c37783.dirty;
- institution :
- Leibniz Institute for Tropospheric Research (TROPOS)
- source :
- TROPOS pyranometer network (PyrNet)
- references :
- https://doi.org/10.5194/amt-9-1153-2016
- Department :
- Remote Sensing of Atmospheric Processes
- Department_team :
- Clouds, Aerosol and Radiation
- Address :
- Permoser Str. 15, 04318 Leipzig, Germany
- Contact_person :
- Andreas Macke and the clouds, aerosol and radiation team of the remote sensing department, mailto:andreas.macke@tropos.de
- Contributor_name :
- Contributor_role :
- Authors_software :
- Hartwig Deneke, Jonas Witthuhn, mailto:deneke@tropos.de
- Creator_name :
- Project :
- Standard_name_vocabulary :
- CF Standard Name Table v81
- License :
- CC-BY-SA 3.0
- TESTNOTE :
- This is a test note.
- processing_level :
- l1b
- product_version :
- 0.2.11+1.g2c37783.dirty
- date_created :
- 2024-05-31T13:47:08
- geospatial_lat_min :
- 51.390210333333336
- geospatial_lat_max :
- 51.390210333333336
- geospatial_lat_units :
- degN
- geospatial_lon_min :
- 11.885252
- geospatial_lon_max :
- 11.885252
- geospatial_lon_units :
- degE
- time_coverage_start :
- 2022-08-30T11:21:01
- time_coverage_end :
- 2022-08-30T11:21:09
- time_coverage_duration :
- P0DT0H0M8S
- time_coverage_resolution :
- P0DT0H0M1S


8.8. qc_flag function
Show code cell source
Hide code cell source
#|export
#|dropcode
def add_qc_flags(ds, vars):
    """
    Add quality flags to flux variables in the dataset.

    Parameters
    ----------
    ds: xr.Dataset
        Dataset with flux variables, dimensions ('time','station'). Also, solar zenith (szen) and azimuth (sazi) angles are required.
        Works for pyrnet l1b and l1b_network files.
    vars: list
        List of flux variable names in ds.

    Returns
    -------
    xr.Dataset
        The input dataset, but with additional 'qc_flag_<fluxvar>' variables.
    """
    # keep only available variables
    vars = [ var for var in vars if var in ds ]

    # init qc flags
    for var in vars:
        ds = init_qc_flag(ds, var)

    # ancillary variables
    szen = ds.szen.values
    mu0 = np.cos(np.deg2rad(szen))
    mu0[mu0 < 0] = 0 #  exclude night
    esd = ds.esd.values
    Sa = CONSTANTS.S0 / esd**2

    # prepare subsample dataset, to be resampled to 30min mean for comparison checks
    dsr = ds.copy()
    dsr = dsr.drop_vars([var for var in dsr if var not in vars])

    # do physical and extreme limit tests
    for var in vars:
        is_tilted = pyrnet.utils.check_tilted(ds[var])
        values = ds[var].values.copy()

        # apply correction if possible
        if np.any(is_tilted):
            vangle = pyrnet.utils.make_iter(ds[var].attrs["vangle"])
            hangle = pyrnet.utils.make_iter(ds[var].attrs["hangle"])
            cfac = pyrnet.utils.tilt_correction_factor(
                dp = vangle,
                dy = hangle,
                szen=ds.szen.values,
                sazi=ds.sazi.values
            )
            mask = is_tilted[None,:] * np.isnan(cfac)
            ds[f"qc_flag_{var}"].values[mask] += QCCode.quality_control_failed
            apply_correction = is_tilted[None,:] * ~np.isnan(cfac)
            values[apply_correction] *= cfac[apply_correction]

        # update subsample dataset
        dsr[var].values = values

        # physical minimum
        mask = values < -4
        ds[f"qc_flag_{var}"].values[mask] += QCCode.below_physical
        # physical maximum
        mask = values > ((Sa * 1.5 * mu0 ** 1.2) + 100)
        ds[f"qc_flag_{var}"].values[mask] += QCCode.above_phyiscal
        # rare limit minimum
        mask = values < -2
        ds[f"qc_flag_{var}"].values[mask] += QCCode.below_rare
        # rare limit maximum
        mask = values > ((Sa * 1.2 * mu0 ** 1.2) + 50)
        ds[f"qc_flag_{var}"].values[mask] += QCCode.above_rare


    # compare all sensors from network, or single station
    window = 30*60
    if dsr.time.size<window:
        window = dsr.time.size
    dsrrolling = dsr.rolling(time=window)
    dsr = dsrrolling.mean(skipna=True)
    dsrmin = dsrrolling.min(skipna=True)
    dsrmax = dsrrolling.max(skipna=True)
    dsr = dsr.where(dsrmin.ghi>0.8*dsrmax.ghi)
    thres_low = np.ones(ds.time.size)*0.9
    thres_high = np.ones(ds.time.size)*1.1
    thres_low[ds.szen.mean("station")>75] = 0.85
    thres_high[ds.szen.mean("station")>75] = 1.15

    all_values_tilted_flag = np.concatenate([pyrnet.utils.check_tilted(dsr[var]) for var in dsr],axis=0)
    all_values = np.concatenate([dsr[var].values for var in dsr],axis=1)
    with warnings.catch_warnings():
        warnings.filterwarnings(action='ignore', message='Mean of empty slice')
        all_values_mean_no_tilt = np.nanmean(all_values[:,~all_values_tilted_flag],axis=1)
        all_values_mean_tilt = np.nanmean(all_values[:,all_values_tilted_flag],axis=1)

    for var in vars:
        is_tilted = pyrnet.utils.check_tilted(ds[var])
        meanvalues = np.repeat(all_values_mean_no_tilt[:,None],dsr[var].shape[1],axis=1)
        meanvalues[:,is_tilted]  = all_values_mean_tilt[:,None]

        ratio = np.ones(dsr[var].shape)
        ratio[meanvalues>50] = dsr[var].values[meanvalues>50] / meanvalues[meanvalues>50]

        # reindex ratio to original resolution
        dsr = dsr.assign({"ratio": (("time","station"), ratio)})
        ratio = dsr.ratio.reindex_like(ds, method='nearest').values
        dsr = dsr.drop_vars(["ratio"])
        # comparison to low
        mask = ratio < thres_low[:,None]
        ds[f"qc_flag_{var}"].values[mask] += QCCode.compare_to_low

        # comparison to high
        mask = ratio > thres_high[:,None]
        ds[f"qc_flag_{var}"].values[mask] += QCCode.compare_to_high

    return ds
8.9. Test add_qc_flag function
# #|dropout
fname = "../../example_data/to_l1b_output.nc"
ds = xr.load_dataset(fname)
ds
Show code cell output
Hide code cell output
<xarray.Dataset> Size: 1kB
Dimensions:               (station: 1, time: 9, maintenancetime: 1)
Coordinates:
  * station               (station) float64 8B 1.0
  * time                  (time) datetime64[ns] 72B 2022-08-30T11:21:01 ... 2...
  * maintenancetime       (maintenancetime) datetime64[ns] 8B 2023-05-08T16:0...
Data variables: (12/20)
    ghi                   (time, station) float64 72B 280.9 280.9 ... 280.9
    gti                   (time, station) float64 72B 288.9 288.9 ... 289.4
    ta                    (time, station) float64 72B 294.8 294.7 ... 294.8
    rh                    (time, station) float64 72B 0.6253 0.6248 ... 0.629
    battery_voltage       (time, station) float64 72B 6.443 6.445 ... 6.465
    gti_min               (time, station) float64 72B 288.7 288.7 ... 288.7
    ...                    ...
    maintenance_flag_gti  (maintenancetime, station) float32 4B 7.0
    szen                  (time, station) float64 72B 42.51 42.51 ... 42.51
    sazi                  (time, station) float64 72B 182.9 182.9 ... 182.9
    esd                   (station) float64 8B 1.01
    qc_flag_ghi           (time, station) float32 36B 0.0 0.0 0.0 ... 0.0 0.0
    qc_flag_gti           (time, station) float32 36B 0.0 0.0 0.0 ... 0.0 0.0
Attributes: (12/31)
    Conventions:               CF-1.10, ACDD-1.3
    title:                     TROPOS pyranometer network (PyrNet) observatio...
    history:                   2024-05-31T13:47:06: Generated level l1a  by p...
    institution:               Leibniz Institute for Tropospheric Research (T...
    source:                    TROPOS pyranometer network (PyrNet)
    references:                https://doi.org/10.5194/amt-9-1153-2016
    ...                        ...
    geospatial_lon_max:        11.885252
    geospatial_lon_units:      degE
    time_coverage_start:       2022-08-30T11:21:01
    time_coverage_end:         2022-08-30T11:21:09
    time_coverage_duration:    P0DT0H0M8S
time_coverage_resolution: P0DT0H0M1S- station: 1
- time: 9
- maintenancetime: 1
- station(station)float641.0
array([1.])
- time(time)datetime64[ns]2022-08-30T11:21:01 ... 2022-08-...
array(['2022-08-30T11:21:01.000000000', '2022-08-30T11:21:02.000000000', '2022-08-30T11:21:03.000000000', '2022-08-30T11:21:04.000000000', '2022-08-30T11:21:05.000000000', '2022-08-30T11:21:06.000000000', '2022-08-30T11:21:07.000000000', '2022-08-30T11:21:08.000000000', '2022-08-30T11:21:09.000000000'], dtype='datetime64[ns]') - maintenancetime(maintenancetime)datetime64[ns]2023-05-08T16:09:06
array(['2023-05-08T16:09:06.000000000'], dtype='datetime64[ns]')
- ghi(time, station)float64280.9 280.9 280.9 ... 280.9 280.9
- units :
- W m-2
- long_name :
- downwelling shortwave flux
- standard_name :
- downwelling_shortwave_flux_in_air
- valid_range :
- [ 0 60000]
- ancillary_variables :
- maintenance_flag_ghi qc_flag_ghi
- serial :
- S12128.001
- calibration_Cabsolute :
- 129366.10608020698
- calibration_Ccoscorr :
- 1.45 - 3.04·x¹ + 5.59·x² - 3.01·x³
- calibration_function :
- flux (W m-2) = flux (V) * Cabsolute (W m-2 V-1) * Ccoscorr(mua)
array([[280.9 ], [280.9 ], [280.9 ], [280.75], [280.9 ], [280.9 ], [280.75], [280.9 ], [280.9 ]]) - gti(time, station)float64288.9 288.9 288.7 ... 288.7 289.4
- units :
- W m-2
- long_name :
- downwelling shortwave flux measured on secondary platform, might be tilted
- standard_name :
- downwelling_shortwave_flux_in_air
- valid_range :
- [ 0 60000]
- ancillary_variables :
- maintenance_flag_gti qc_flag_gti
- hangle :
- 0.0
- vangle :
- 0.0
- serial :
- S12137.049
- calibration_Cabsolute :
- 143266.47564469912
- calibration_Ccoscorr :
- 1.45 - 3.04·x¹ + 5.59·x² - 3.01·x³
- calibration_function :
- flux (W m-2) = flux (V) * Cabsolute (W m-2 V-1) * Ccoscorr(mua)
array([[288.95 ], [288.95 ], [288.65 ], [288.65 ], [288.8 ], [288.65 ], [288.325], [288.65 ], [289.45 ]]) - ta(time, station)float64294.8 294.7 294.8 ... 294.7 294.8
- units :
- K
- long_name :
- air temperature
- standard_name :
- air_temperature
- valid_range :
- [ 0 10000]
array([[294.8 ], [294.74], [294.77], [294.75], [294.79], [294.75], [294.81], [294.73], [294.76]]) - rh(time, station)float640.6253 0.6248 ... 0.628 0.629
- units :
- 1
- long_name :
- air relative humidity
- standard_name :
- relative_humidity
- valid_range :
- [ 0 10000]
array([[0.6253], [0.6248], [0.6259], [0.6266], [0.6271], [0.6271], [0.6286], [0.628 ], [0.629 ]]) - battery_voltage(time, station)float646.443 6.445 6.444 ... 6.449 6.465
- units :
- V
- standard_name :
- battery_voltage
- valid_range :
- [ 0 6400]
array([[6.443], [6.445], [6.444], [6.446], [6.45 ], [6.448], [6.446], [6.449], [6.465]]) - gti_min(time, station)float64288.7 288.7 288.7 ... 288.7 288.7
- units :
- W m-2
- long_name :
- downwelling shortwave flux measured on secondary platform, might be tilted
- standard_name :
- min_downwelling_shortwave_flux_in_air
- valid_range :
- [ 0 60000]
- ancillary_variables :
- maintenance_flag_gti
- hangle :
- 0.0
- vangle :
- 0.0
- serial :
- S12137.049
- calibration_Cabsolute :
- 143266.47564469912
- calibration_Ccoscorr :
- 1.45 - 3.04·x¹ + 5.59·x² - 3.01·x³
- calibration_function :
- flux (W m-2) = flux (V) * Cabsolute (W m-2 V-1) * Ccoscorr(mua)
array([[288.65 ], [288.65 ], [288.65 ], [287.025], [287.025], [288.65 ], [287.025], [288.65 ], [288.65 ]]) - ghi_min(time, station)float64280.9 280.9 280.9 ... 280.9 280.9
- units :
- W m-2
- long_name :
- downwelling shortwave flux
- standard_name :
- min_downwelling_shortwave_flux_in_air
- valid_range :
- [ 0 60000]
- ancillary_variables :
- maintenance_flag_ghi
- serial :
- S12128.001
- calibration_Cabsolute :
- 129366.10608020698
- calibration_Ccoscorr :
- 1.45 - 3.04·x¹ + 5.59·x² - 3.01·x³
- calibration_function :
- flux (W m-2) = flux (V) * Cabsolute (W m-2 V-1) * Ccoscorr(mua)
array([[280.9 ], [280.9 ], [280.9 ], [279.45], [280.9 ], [280.9 ], [279.45], [280.9 ], [280.9 ]]) - gti_max(time, station)float64290.2 290.2 288.7 ... 288.7 290.2
- units :
- W m-2
- long_name :
- downwelling shortwave flux measured on secondary platform, might be tilted
- standard_name :
- max_downwelling_shortwave_flux_in_air
- valid_range :
- [ 0 60000]
- ancillary_variables :
- maintenance_flag_gti
- hangle :
- 0.0
- vangle :
- 0.0
- serial :
- S12137.049
- calibration_Cabsolute :
- 143266.47564469912
- calibration_Ccoscorr :
- 1.45 - 3.04·x¹ + 5.59·x² - 3.01·x³
- calibration_function :
- flux (W m-2) = flux (V) * Cabsolute (W m-2 V-1) * Ccoscorr(mua)
array([[290.25], [290.25], [288.65], [290.25], [290.25], [288.65], [288.65], [288.65], [290.25]]) - ghi_max(time, station)float64280.9 280.9 280.9 ... 280.9 280.9
- units :
- W m-2
- long_name :
- downwelling shortwave flux
- standard_name :
- max_downwelling_shortwave_flux_in_air
- valid_range :
- [ 0 60000]
- ancillary_variables :
- maintenance_flag_ghi
- serial :
- S12128.001
- calibration_Cabsolute :
- 129366.10608020698
- calibration_Ccoscorr :
- 1.45 - 3.04·x¹ + 5.59·x² - 3.01·x³
- calibration_function :
- flux (W m-2) = flux (V) * Cabsolute (W m-2 V-1) * Ccoscorr(mua)
array([[280.9], [280.9], [280.9], [280.9], [280.9], [280.9], [280.9], [280.9], [280.9]]) - gti_std(time, station)float640.725 0.675 0.0 ... 0.675 0.0 1.125
- units :
- W m-2
- long_name :
- downwelling shortwave flux measured on secondary platform, might be tilted
- standard_name :
- std_downwelling_shortwave_flux_in_air
- valid_range :
- [ 0 60000]
- ancillary_variables :
- maintenance_flag_gti
- hangle :
- 0.0
- vangle :
- 0.0
- serial :
- S12137.049
- calibration_Cabsolute :
- 143266.47564469912
- calibration_Ccoscorr :
- 1.45 - 3.04·x¹ + 5.59·x² - 3.01·x³
- calibration_function :
- flux (W m-2) = flux (V) * Cabsolute (W m-2 V-1) * Ccoscorr(mua)
array([[0.725], [0.675], [0. ], [0.75 ], [0.9 ], [0. ], [0.675], [0. ], [1.125]]) - ghi_std(time, station)float640.0 0.0 0.0 0.45 ... 0.45 0.0 0.0
- units :
- W m-2
- long_name :
- downwelling shortwave flux
- standard_name :
- std_downwelling_shortwave_flux_in_air
- valid_range :
- [ 0 60000]
- ancillary_variables :
- maintenance_flag_ghi
- serial :
- S12128.001
- calibration_Cabsolute :
- 129366.10608020698
- calibration_Ccoscorr :
- 1.45 - 3.04·x¹ + 5.59·x² - 3.01·x³
- calibration_function :
- flux (W m-2) = flux (V) * Cabsolute (W m-2 V-1) * Ccoscorr(mua)
array([[0. ], [0. ], [0. ], [0.45], [0. ], [0. ], [0.45], [0. ], [0. ]]) - lat(station)float6451.39
- standard_name :
- latitude
- units :
- degree_north
- valid_range :
- [-90. 90.]
array([51.39021033])
- lon(station)float6411.89
- standard_name :
- longitude
- units :
- degree_east
- valid_range :
- [-180. 180.]
array([11.885252])
- maintenance_flag_ghi(maintenancetime, station)float329.0
- standard_name :
- quality_flag
- long_name :
- Maintenance quality control flags
- note :
- Soiling describes subjectively the coverage of the pyranometer dome with dirt. The level flag is problematic if the bubble of the spirit level touches the reference ring, and bad if it is outside.
- valid_range :
- [ 0 11]
- flag_masks :
- [ 3 3 3 12 12]
- flag_values :
- [1 2 3 4 8]
- flag_meanings :
- soiling_light soiling_moderate soiling_heavy level_problematic level_bad
- note_general :
- 222
- note_clean :
- testing notes
- note_level :
- test
array([[9.]], dtype=float32)
- maintenance_flag_gti(maintenancetime, station)float327.0
- standard_name :
- quality_flag
- long_name :
- Maintenance quality control flags
- note :
- Soiling describes subjectively the coverage of the pyranometer dome with dirt. The level flag is problematic if the bubble of the spirit level touches the reference ring, and bad if it is outside.
- valid_range :
- [ 0 11]
- flag_masks :
- [ 3 3 3 12 12]
- flag_values :
- [1 2 3 4 8]
- flag_meanings :
- soiling_light soiling_moderate soiling_heavy level_problematic level_bad
- note_general :
- 222
- note_clean :
- note_level :
array([[7.]], dtype=float32)
- szen(time, station)float6442.51 42.51 42.51 ... 42.51 42.51
- standard_name :
- solar_zenith_angle
- units :
- degree
- valid_range :
- [ 0 36000]
array([[42.51], [42.51], [42.51], [42.51], [42.51], [42.51], [42.51], [42.51], [42.51]]) - sazi(time, station)float64182.9 182.9 182.9 ... 182.9 182.9
- standard_name :
- solar_azimuth_angle
- units :
- degree
- valid_range :
- [ 0 36000]
array([[182.89], [182.9 ], [182.91], [182.91], [182.92], [182.93], [182.93], [182.94], [182.94]]) - esd(station)float641.01
- long_name :
- Earth-sun distance
- note :
- Calculated based on Spencer (1971), as mean of its values over all time steps.
- units :
- ua
array([1.00959973])
- qc_flag_ghi(time, station)float320.0 0.0 0.0 0.0 0.0 0.0 0.0 0.0 0.0
- standard_name :
- quality_flag
- ancillary_variables :
- ghi
- valid_range :
- [ 0 127]
- flag_masks :
- [ 1 2 4 8 16 32 64]
- flag_values :
- [ 1 2 4 8 16 32 64]
- flag_meanings :
- below_physical_limit above_physical_limit below_rare_limit above_rare_limit comparison_to_low comparison_to_high quality_control_failed
array([[0.], [0.], [0.], [0.], [0.], [0.], [0.], [0.], [0.]], dtype=float32) - qc_flag_gti(time, station)float320.0 0.0 0.0 0.0 0.0 0.0 0.0 0.0 0.0
- standard_name :
- quality_flag
- ancillary_variables :
- gti
- valid_range :
- [ 0 127]
- flag_masks :
- [ 1 2 4 8 16 32 64]
- flag_values :
- [ 1 2 4 8 16 32 64]
- flag_meanings :
- below_physical_limit above_physical_limit below_rare_limit above_rare_limit comparison_to_low comparison_to_high quality_control_failed
array([[0.],
       [0.],
       [0.],
       [0.],
       [0.],
       [0.],
       [0.],
       [0.],
       [0.]], dtype=float32)
- stationPandasIndex
PandasIndex(Index([1.0], dtype='float64', name='station'))
- timePandasIndex
PandasIndex(DatetimeIndex(['2022-08-30 11:21:01', '2022-08-30 11:21:02', '2022-08-30 11:21:03', '2022-08-30 11:21:04', '2022-08-30 11:21:05', '2022-08-30 11:21:06', '2022-08-30 11:21:07', '2022-08-30 11:21:08', '2022-08-30 11:21:09'], dtype='datetime64[ns]', name='time', freq=None)) - maintenancetimePandasIndex
PandasIndex(DatetimeIndex(['2023-05-08 16:09:06'], dtype='datetime64[ns]', name='maintenancetime', freq=None))
- Conventions :
- CF-1.10, ACDD-1.3
- title :
- TROPOS pyranometer network (PyrNet) observational data set
- history :
- 2024-05-31T13:47:06: Generated level l1a by pyrnet version 0.2.11+1.g2c37783.dirty; 2024-05-31T13:47:08: Generated level l1b by pyrnet version 0.2.11+1.g2c37783.dirty;
- institution :
- Leibniz Institute for Tropospheric Research (TROPOS)
- source :
- TROPOS pyranometer network (PyrNet)
- references :
- https://doi.org/10.5194/amt-9-1153-2016
- Department :
- Remote Sensing of Atmospheric Processes
- Department_team :
- Clouds, Aerosol and Radiation
- Address :
- Permoser Str. 15, 04318 Leipzig, Germany
- Contact_person :
- Andreas Macke and the clouds, aerosol and radiation team of the remote sensing department, mailto:andreas.macke@tropos.de
- Contributor_name :
- Contributor_role :
- Authors_software :
- Hartwig Deneke, Jonas Witthuhn, mailto:deneke@tropos.de
- Creator_name :
- Project :
- Standard_name_vocabulary :
- CF Standard Name Table v81
- License :
- CC-BY-SA 3.0
- TESTNOTE :
- This is a test note.
- processing_level :
- l1b
- product_version :
- 0.2.11+1.g2c37783.dirty
- date_created :
- 2024-05-31T13:47:08
- geospatial_lat_min :
- 51.390210333333336
- geospatial_lat_max :
- 51.390210333333336
- geospatial_lat_units :
- degN
- geospatial_lon_min :
- 11.885252
- geospatial_lon_max :
- 11.885252
- geospatial_lon_units :
- degE
- time_coverage_start :
- 2022-08-30T11:21:01
- time_coverage_end :
- 2022-08-30T11:21:09
- time_coverage_duration :
- P0DT0H0M8S
- time_coverage_resolution :
- P0DT0H0M1S
%load_ext memory_profiler
from pyrnet.qcrad import add_qc_flags as test_add_qc_flags
# %%mprun -f test_add_qc_flags
# _ = test_add_qc_flags(ds, ["ghi", "gti"])
#|dropout
ds = add_qc_flags(ds, ["ghi", "gti"])
ds
Show code cell output
Hide code cell output
<xarray.Dataset> Size: 1kB
Dimensions:               (station: 1, time: 9, maintenancetime: 1)
Coordinates:
  * station               (station) float64 8B 1.0
  * time                  (time) datetime64[ns] 72B 2022-08-30T11:21:01 ... 2...
  * maintenancetime       (maintenancetime) datetime64[ns] 8B 2023-05-08T16:0...
Data variables: (12/20)
    ghi                   (time, station) float64 72B 280.9 280.9 ... 280.9
    gti                   (time, station) float64 72B 288.9 288.9 ... 289.4
    ta                    (time, station) float64 72B 294.8 294.7 ... 294.8
    rh                    (time, station) float64 72B 0.6253 0.6248 ... 0.629
    battery_voltage       (time, station) float64 72B 6.443 6.445 ... 6.465
    gti_min               (time, station) float64 72B 288.7 288.7 ... 288.7
    ...                    ...
    maintenance_flag_gti  (maintenancetime, station) float32 4B 7.0
    szen                  (time, station) float64 72B 42.51 42.51 ... 42.51
    sazi                  (time, station) float64 72B 182.9 182.9 ... 182.9
    esd                   (station) float64 8B 1.01
    qc_flag_ghi           (time, station) uint8 9B 0 0 0 0 0 0 0 0 0
    qc_flag_gti           (time, station) uint8 9B 0 0 0 0 0 0 0 0 0
Attributes: (12/31)
    Conventions:               CF-1.10, ACDD-1.3
    title:                     TROPOS pyranometer network (PyrNet) observatio...
    history:                   2024-05-31T13:47:06: Generated level l1a  by p...
    institution:               Leibniz Institute for Tropospheric Research (T...
    source:                    TROPOS pyranometer network (PyrNet)
    references:                https://doi.org/10.5194/amt-9-1153-2016
    ...                        ...
    geospatial_lon_max:        11.885252
    geospatial_lon_units:      degE
    time_coverage_start:       2022-08-30T11:21:01
    time_coverage_end:         2022-08-30T11:21:09
    time_coverage_duration:    P0DT0H0M8S
time_coverage_resolution: P0DT0H0M1S- station: 1
- time: 9
- maintenancetime: 1
- station(station)float641.0
array([1.])
- time(time)datetime64[ns]2022-08-30T11:21:01 ... 2022-08-...
array(['2022-08-30T11:21:01.000000000', '2022-08-30T11:21:02.000000000', '2022-08-30T11:21:03.000000000', '2022-08-30T11:21:04.000000000', '2022-08-30T11:21:05.000000000', '2022-08-30T11:21:06.000000000', '2022-08-30T11:21:07.000000000', '2022-08-30T11:21:08.000000000', '2022-08-30T11:21:09.000000000'], dtype='datetime64[ns]') - maintenancetime(maintenancetime)datetime64[ns]2023-05-08T16:09:06
array(['2023-05-08T16:09:06.000000000'], dtype='datetime64[ns]')
- ghi(time, station)float64280.9 280.9 280.9 ... 280.9 280.9
- units :
- W m-2
- long_name :
- downwelling shortwave flux
- standard_name :
- downwelling_shortwave_flux_in_air
- valid_range :
- [ 0 60000]
- ancillary_variables :
- maintenance_flag_ghi qc_flag_ghi
- serial :
- S12128.001
- calibration_Cabsolute :
- 129366.10608020698
- calibration_Ccoscorr :
- 1.45 - 3.04·x¹ + 5.59·x² - 3.01·x³
- calibration_function :
- flux (W m-2) = flux (V) * Cabsolute (W m-2 V-1) * Ccoscorr(mua)
array([[280.9 ], [280.9 ], [280.9 ], [280.75], [280.9 ], [280.9 ], [280.75], [280.9 ], [280.9 ]]) - gti(time, station)float64288.9 288.9 288.7 ... 288.7 289.4
- units :
- W m-2
- long_name :
- downwelling shortwave flux measured on secondary platform, might be tilted
- standard_name :
- downwelling_shortwave_flux_in_air
- valid_range :
- [ 0 60000]
- ancillary_variables :
- maintenance_flag_gti qc_flag_gti
- hangle :
- 0.0
- vangle :
- 0.0
- serial :
- S12137.049
- calibration_Cabsolute :
- 143266.47564469912
- calibration_Ccoscorr :
- 1.45 - 3.04·x¹ + 5.59·x² - 3.01·x³
- calibration_function :
- flux (W m-2) = flux (V) * Cabsolute (W m-2 V-1) * Ccoscorr(mua)
array([[288.95 ], [288.95 ], [288.65 ], [288.65 ], [288.8 ], [288.65 ], [288.325], [288.65 ], [289.45 ]]) - ta(time, station)float64294.8 294.7 294.8 ... 294.7 294.8
- units :
- K
- long_name :
- air temperature
- standard_name :
- air_temperature
- valid_range :
- [ 0 10000]
array([[294.8 ], [294.74], [294.77], [294.75], [294.79], [294.75], [294.81], [294.73], [294.76]]) - rh(time, station)float640.6253 0.6248 ... 0.628 0.629
- units :
- 1
- long_name :
- air relative humidity
- standard_name :
- relative_humidity
- valid_range :
- [ 0 10000]
array([[0.6253], [0.6248], [0.6259], [0.6266], [0.6271], [0.6271], [0.6286], [0.628 ], [0.629 ]]) - battery_voltage(time, station)float646.443 6.445 6.444 ... 6.449 6.465
- units :
- V
- standard_name :
- battery_voltage
- valid_range :
- [ 0 6400]
array([[6.443], [6.445], [6.444], [6.446], [6.45 ], [6.448], [6.446], [6.449], [6.465]]) - gti_min(time, station)float64288.7 288.7 288.7 ... 288.7 288.7
- units :
- W m-2
- long_name :
- downwelling shortwave flux measured on secondary platform, might be tilted
- standard_name :
- min_downwelling_shortwave_flux_in_air
- valid_range :
- [ 0 60000]
- ancillary_variables :
- maintenance_flag_gti
- hangle :
- 0.0
- vangle :
- 0.0
- serial :
- S12137.049
- calibration_Cabsolute :
- 143266.47564469912
- calibration_Ccoscorr :
- 1.45 - 3.04·x¹ + 5.59·x² - 3.01·x³
- calibration_function :
- flux (W m-2) = flux (V) * Cabsolute (W m-2 V-1) * Ccoscorr(mua)
array([[288.65 ], [288.65 ], [288.65 ], [287.025], [287.025], [288.65 ], [287.025], [288.65 ], [288.65 ]]) - ghi_min(time, station)float64280.9 280.9 280.9 ... 280.9 280.9
- units :
- W m-2
- long_name :
- downwelling shortwave flux
- standard_name :
- min_downwelling_shortwave_flux_in_air
- valid_range :
- [ 0 60000]
- ancillary_variables :
- maintenance_flag_ghi
- serial :
- S12128.001
- calibration_Cabsolute :
- 129366.10608020698
- calibration_Ccoscorr :
- 1.45 - 3.04·x¹ + 5.59·x² - 3.01·x³
- calibration_function :
- flux (W m-2) = flux (V) * Cabsolute (W m-2 V-1) * Ccoscorr(mua)
array([[280.9 ], [280.9 ], [280.9 ], [279.45], [280.9 ], [280.9 ], [279.45], [280.9 ], [280.9 ]]) - gti_max(time, station)float64290.2 290.2 288.7 ... 288.7 290.2
- units :
- W m-2
- long_name :
- downwelling shortwave flux measured on secondary platform, might be tilted
- standard_name :
- max_downwelling_shortwave_flux_in_air
- valid_range :
- [ 0 60000]
- ancillary_variables :
- maintenance_flag_gti
- hangle :
- 0.0
- vangle :
- 0.0
- serial :
- S12137.049
- calibration_Cabsolute :
- 143266.47564469912
- calibration_Ccoscorr :
- 1.45 - 3.04·x¹ + 5.59·x² - 3.01·x³
- calibration_function :
- flux (W m-2) = flux (V) * Cabsolute (W m-2 V-1) * Ccoscorr(mua)
array([[290.25], [290.25], [288.65], [290.25], [290.25], [288.65], [288.65], [288.65], [290.25]]) - ghi_max(time, station)float64280.9 280.9 280.9 ... 280.9 280.9
- units :
- W m-2
- long_name :
- downwelling shortwave flux
- standard_name :
- max_downwelling_shortwave_flux_in_air
- valid_range :
- [ 0 60000]
- ancillary_variables :
- maintenance_flag_ghi
- serial :
- S12128.001
- calibration_Cabsolute :
- 129366.10608020698
- calibration_Ccoscorr :
- 1.45 - 3.04·x¹ + 5.59·x² - 3.01·x³
- calibration_function :
- flux (W m-2) = flux (V) * Cabsolute (W m-2 V-1) * Ccoscorr(mua)
array([[280.9], [280.9], [280.9], [280.9], [280.9], [280.9], [280.9], [280.9], [280.9]]) - gti_std(time, station)float640.725 0.675 0.0 ... 0.675 0.0 1.125
- units :
- W m-2
- long_name :
- downwelling shortwave flux measured on secondary platform, might be tilted
- standard_name :
- std_downwelling_shortwave_flux_in_air
- valid_range :
- [ 0 60000]
- ancillary_variables :
- maintenance_flag_gti
- hangle :
- 0.0
- vangle :
- 0.0
- serial :
- S12137.049
- calibration_Cabsolute :
- 143266.47564469912
- calibration_Ccoscorr :
- 1.45 - 3.04·x¹ + 5.59·x² - 3.01·x³
- calibration_function :
- flux (W m-2) = flux (V) * Cabsolute (W m-2 V-1) * Ccoscorr(mua)
array([[0.725], [0.675], [0. ], [0.75 ], [0.9 ], [0. ], [0.675], [0. ], [1.125]]) - ghi_std(time, station)float640.0 0.0 0.0 0.45 ... 0.45 0.0 0.0
- units :
- W m-2
- long_name :
- downwelling shortwave flux
- standard_name :
- std_downwelling_shortwave_flux_in_air
- valid_range :
- [ 0 60000]
- ancillary_variables :
- maintenance_flag_ghi
- serial :
- S12128.001
- calibration_Cabsolute :
- 129366.10608020698
- calibration_Ccoscorr :
- 1.45 - 3.04·x¹ + 5.59·x² - 3.01·x³
- calibration_function :
- flux (W m-2) = flux (V) * Cabsolute (W m-2 V-1) * Ccoscorr(mua)
array([[0. ], [0. ], [0. ], [0.45], [0. ], [0. ], [0.45], [0. ], [0. ]]) - lat(station)float6451.39
- standard_name :
- latitude
- units :
- degree_north
- valid_range :
- [-90. 90.]
array([51.39021033])
- lon(station)float6411.89
- standard_name :
- longitude
- units :
- degree_east
- valid_range :
- [-180. 180.]
array([11.885252])
- maintenance_flag_ghi(maintenancetime, station)float329.0
- standard_name :
- quality_flag
- long_name :
- Maintenance quality control flags
- note :
- Soiling describes subjectively the coverage of the pyranometer dome with dirt. The level flag is problematic if the bubble of the spirit level touches the reference ring, and bad if it is outside.
- valid_range :
- [ 0 11]
- flag_masks :
- [ 3 3 3 12 12]
- flag_values :
- [1 2 3 4 8]
- flag_meanings :
- soiling_light soiling_moderate soiling_heavy level_problematic level_bad
- note_general :
- 222
- note_clean :
- testing notes
- note_level :
- test
array([[9.]], dtype=float32)
- maintenance_flag_gti(maintenancetime, station)float327.0
- standard_name :
- quality_flag
- long_name :
- Maintenance quality control flags
- note :
- Soiling describes subjectively the coverage of the pyranometer dome with dirt. The level flag is problematic if the bubble of the spirit level touches the reference ring, and bad if it is outside.
- valid_range :
- [ 0 11]
- flag_masks :
- [ 3 3 3 12 12]
- flag_values :
- [1 2 3 4 8]
- flag_meanings :
- soiling_light soiling_moderate soiling_heavy level_problematic level_bad
- note_general :
- 222
- note_clean :
- note_level :
array([[7.]], dtype=float32)
- szen(time, station)float6442.51 42.51 42.51 ... 42.51 42.51
- standard_name :
- solar_zenith_angle
- units :
- degree
- valid_range :
- [ 0 36000]
array([[42.51], [42.51], [42.51], [42.51], [42.51], [42.51], [42.51], [42.51], [42.51]]) - sazi(time, station)float64182.9 182.9 182.9 ... 182.9 182.9
- standard_name :
- solar_azimuth_angle
- units :
- degree
- valid_range :
- [ 0 36000]
array([[182.89], [182.9 ], [182.91], [182.91], [182.92], [182.93], [182.93], [182.94], [182.94]]) - esd(station)float641.01
- long_name :
- Earth-sun distance
- note :
- Calculated based on Spencer (1971), as mean of its values over all time steps.
- units :
- ua
array([1.00959973])
- qc_flag_ghi(time, station)uint80 0 0 0 0 0 0 0 0
- standard_name :
- quality_flag
- ancillary_variables :
- ghi
- valid_range :
- [0, np.int64(127)]
- flag_masks :
- [1, 2, 4, 8, 16, 32, 64]
- flag_values :
- [1, 2, 4, 8, 16, 32, 64]
- flag_meanings :
- below_physical_limit above_physical_limit below_rare_limit above_rare_limit comparison_to_low comparison_to_high quality_control_failed
array([[0], [0], [0], [0], [0], [0], [0], [0], [0]], dtype=uint8) - qc_flag_gti(time, station)uint80 0 0 0 0 0 0 0 0
- standard_name :
- quality_flag
- ancillary_variables :
- gti
- valid_range :
- [0, np.int64(127)]
- flag_masks :
- [1, 2, 4, 8, 16, 32, 64]
- flag_values :
- [1, 2, 4, 8, 16, 32, 64]
- flag_meanings :
- below_physical_limit above_physical_limit below_rare_limit above_rare_limit comparison_to_low comparison_to_high quality_control_failed
array([[0],
       [0],
       [0],
       [0],
       [0],
       [0],
       [0],
       [0],
       [0]], dtype=uint8)
- stationPandasIndex
PandasIndex(Index([1.0], dtype='float64', name='station'))
- timePandasIndex
PandasIndex(DatetimeIndex(['2022-08-30 11:21:01', '2022-08-30 11:21:02', '2022-08-30 11:21:03', '2022-08-30 11:21:04', '2022-08-30 11:21:05', '2022-08-30 11:21:06', '2022-08-30 11:21:07', '2022-08-30 11:21:08', '2022-08-30 11:21:09'], dtype='datetime64[ns]', name='time', freq=None)) - maintenancetimePandasIndex
PandasIndex(DatetimeIndex(['2023-05-08 16:09:06'], dtype='datetime64[ns]', name='maintenancetime', freq=None))
- Conventions :
- CF-1.10, ACDD-1.3
- title :
- TROPOS pyranometer network (PyrNet) observational data set
- history :
- 2024-05-31T13:47:06: Generated level l1a by pyrnet version 0.2.11+1.g2c37783.dirty; 2024-05-31T13:47:08: Generated level l1b by pyrnet version 0.2.11+1.g2c37783.dirty;
- institution :
- Leibniz Institute for Tropospheric Research (TROPOS)
- source :
- TROPOS pyranometer network (PyrNet)
- references :
- https://doi.org/10.5194/amt-9-1153-2016
- Department :
- Remote Sensing of Atmospheric Processes
- Department_team :
- Clouds, Aerosol and Radiation
- Address :
- Permoser Str. 15, 04318 Leipzig, Germany
- Contact_person :
- Andreas Macke and the clouds, aerosol and radiation team of the remote sensing department, mailto:andreas.macke@tropos.de
- Contributor_name :
- Contributor_role :
- Authors_software :
- Hartwig Deneke, Jonas Witthuhn, mailto:deneke@tropos.de
- Creator_name :
- Project :
- Standard_name_vocabulary :
- CF Standard Name Table v81
- License :
- CC-BY-SA 3.0
- TESTNOTE :
- This is a test note.
- processing_level :
- l1b
- product_version :
- 0.2.11+1.g2c37783.dirty
- date_created :
- 2024-05-31T13:47:08
- geospatial_lat_min :
- 51.390210333333336
- geospatial_lat_max :
- 51.390210333333336
- geospatial_lat_units :
- degN
- geospatial_lon_min :
- 11.885252
- geospatial_lon_max :
- 11.885252
- geospatial_lon_units :
- degE
- time_coverage_start :
- 2022-08-30T11:21:01
- time_coverage_end :
- 2022-08-30T11:21:09
- time_coverage_duration :
- P0DT0H0M8S
- time_coverage_resolution :
- P0DT0H0M1S
8.10. add_flag function
Show code cell source
Hide code cell source
#|export
#|dropcode
def add_add_flags(ds, vars):
    """
    Add additional flags to flux variables in the dataset.

    Parameters
    ----------
    ds: xr.Dataset
        Dataset with flux variables, dimensions ('time','station'). Also, solar zenith (szen) angle and <var>_std variable are required.
        Works for pyrnet l1b and l1b_network files.
    vars: list
        List of flux variable names in ds.

    Returns
    -------
    xr.Dataset
        The input dataset, but with additional 'add_flag_<fluxvar>' variables.
    """
    # keep only available variables
    vars = [ var for var in vars if var in ds ]

    # init qc flags
    for var in vars:
        ds = init_additional_flag(ds, var)

    # ancillary variables
    szen = ds.szen.values
    mu0 = np.cos(np.deg2rad(szen))

    for var in vars:
        pmean = np.nanmean(ds[var].values,axis=1)
        pstd = np.nanstd(ds[var].values,axis=1)

        # flag lower outlier
        # deviation > 3 sigma of certain time step and only if irradiance lower 100Wm-2*mu0
        newflag = (ds[var].values<(pmean-3*pstd)[:,None])*(ds[var].values<100*mu0)
        newflag *= mu0>0 # exclude nigth

        # flag high fluctuation
        # if fluctuation of sampling within resolution is very high (std>100Wm-2*mu0) its probably logger failiure, or bird, or hand  (very strong shadow within short period)
        if f"{var}_std" not in ds:
            ds[f"add_flag_{var}"].values += FLCode.not_applicable
            newflag2 = np.zeros(ds[var].shape).astype(bool)
        else:
            newflag2 = ds[f"{var}_std"].values>(100*mu0)
            newflag2 *= mu0>0

        # for savety flag 10min around incident
        newflag = np.apply_along_axis(lambda m: np.convolve(m, np.ones(5*60), mode='same'), axis=0, arr=newflag)
        newflag = newflag.astype(bool)

        newflag2 = np.apply_along_axis(lambda m: np.convolve(m, np.ones(5*60), mode='same'), axis=0, arr=newflag2)
        newflag2 = newflag2.astype(bool)

        # add Flag Code
        ds[f"add_flag_{var}"].values[newflag] += FLCode.low_outlier
        ds[f"add_flag_{var}"].values[newflag2] += FLCode.strong_fluctuation

    return ds